

Bearish signals...
Bearish signals...
Market Commentary for the week from 02/13/23 to 02/17/23 • Issue No. 24 • Analysis and Outlook elaborated by @PointBlank_Algo • GEX charts and data by @TradeVolatility

REVIEW
Last week in our regular "NEXT WEEK, The Bear's take, The Bull's take, Our take" we said we were expecting a retest of the breakout areas.
"Expecting retest of #SPX 4100 breakout, #DJI 33350 area, #NDX 12000 area."
The retest occurred as expected and so far the breakout zones have not been broken, however some bearish signals have appeared.
This data-heavy week, especially the CPI and core CPI, will move the market in a decisive way and will define whether the medium-term uptrend remains in place or if we will start a new bearish leg. This presents an excellent trading opportunity for two important reasons: The first is that the move following the breakout of certain levels will be of magnitude and secondly because there is a high possibility that after the breakout there will be a continuation in the same direction.
Let's see what lights are shed on this in our analysis this week.
ANALYSIS
SPX / SPY / ES
From a daily chart standpoint, SPX closed positive on Friday on low volume, while down on Wednesday and Thursday on higher volume. That indicates that there was distribution this week. Bad sign.
It managed on Friday to reverse a day that started negative by bouncing from near the 20DMA. It managed to close above the crucial 4074 support, but below the also important 4100.
During the week it printed daily candles with lower highs and also lower lows, not a good sign.
Of the classic indicators CCI generated a sell signal on Wednesday at the same time as Stochastics. MACD generated a sell signal on Friday. This is not a good sign either.
Viewed from the weekly chart SPX closed negative on low volume, which is good, but printed a bearish Harami candlestick. It was rejected from the 100WMA the week before this and has not approached there again.

The classic indicators remain on a buy signal except for Stochastics which crossed below 80 on Friday.
As for market breadth Put/Call ratios they remain on a buy signal, but High/Low and Adv/Dec ratios have been very negative and have turned to a Sell signal.
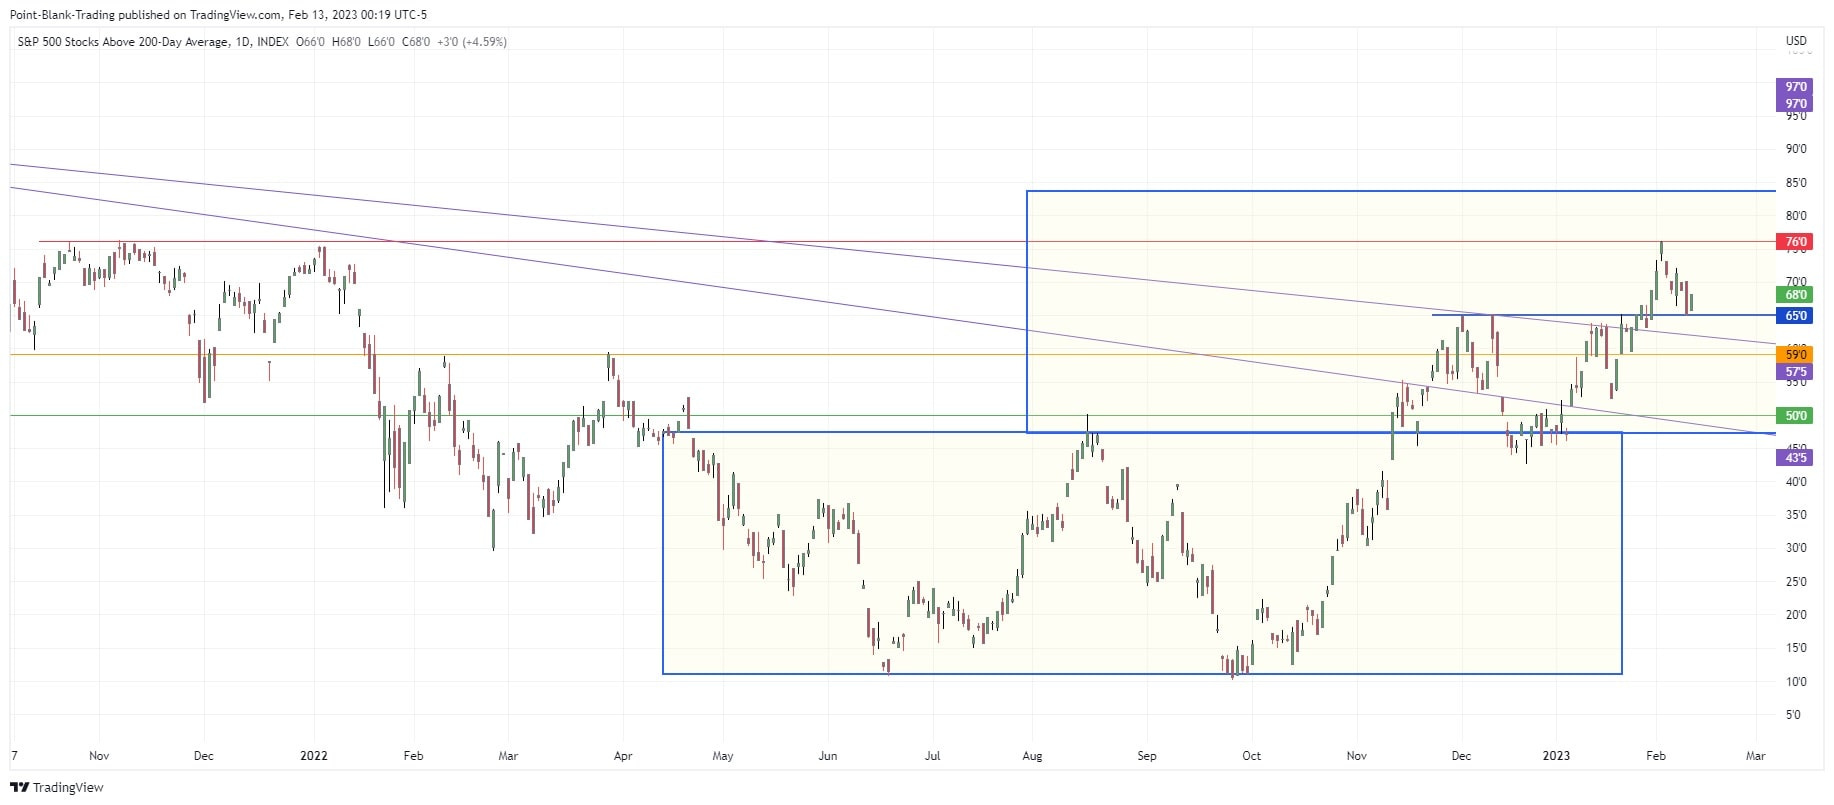
The SPX stocks above 200DMA Index touched the important breakout line at 65% (the December highs), but the previous week it touched the August high and made a pullback. Put another way with its close on Friday at 68% it remains trapped in the range from the December highs to the August highs. A break of either level will signal the near-term path for the SPX.
It also printed a bearish Harami candle on its weekly chart.
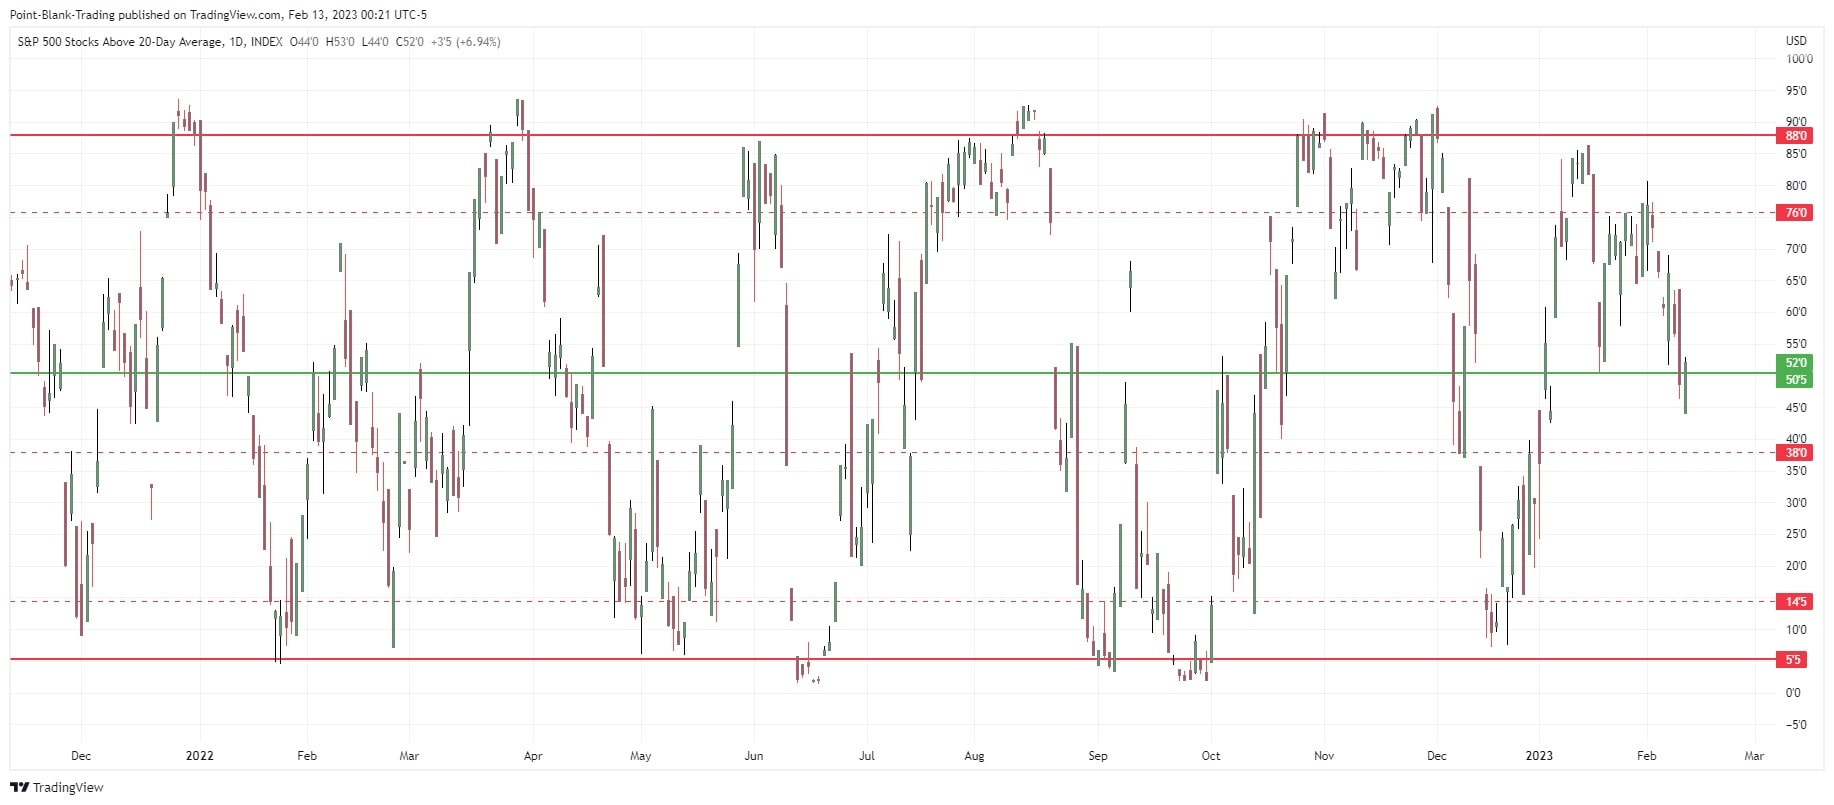
The SPX stocks above 20DMA Index has been the hardest hit, it is of course the most sensitive to very short term moves. It closed below its 20DMA on Feb-03.2023 and has remained below. On Friday it also went below the very important 50% level, touching 44%, but recovered and managed to close at 52%. This is somewhat positive if it manages to continue the upward movement. A close in the next few days below 50% would signal a marked internal weakening of the SPX and a halt of its upward move
The SPX stocks above 50DMA Index had a similar event when it went below important support at 63.5%, but managed to recover and close at 65%.
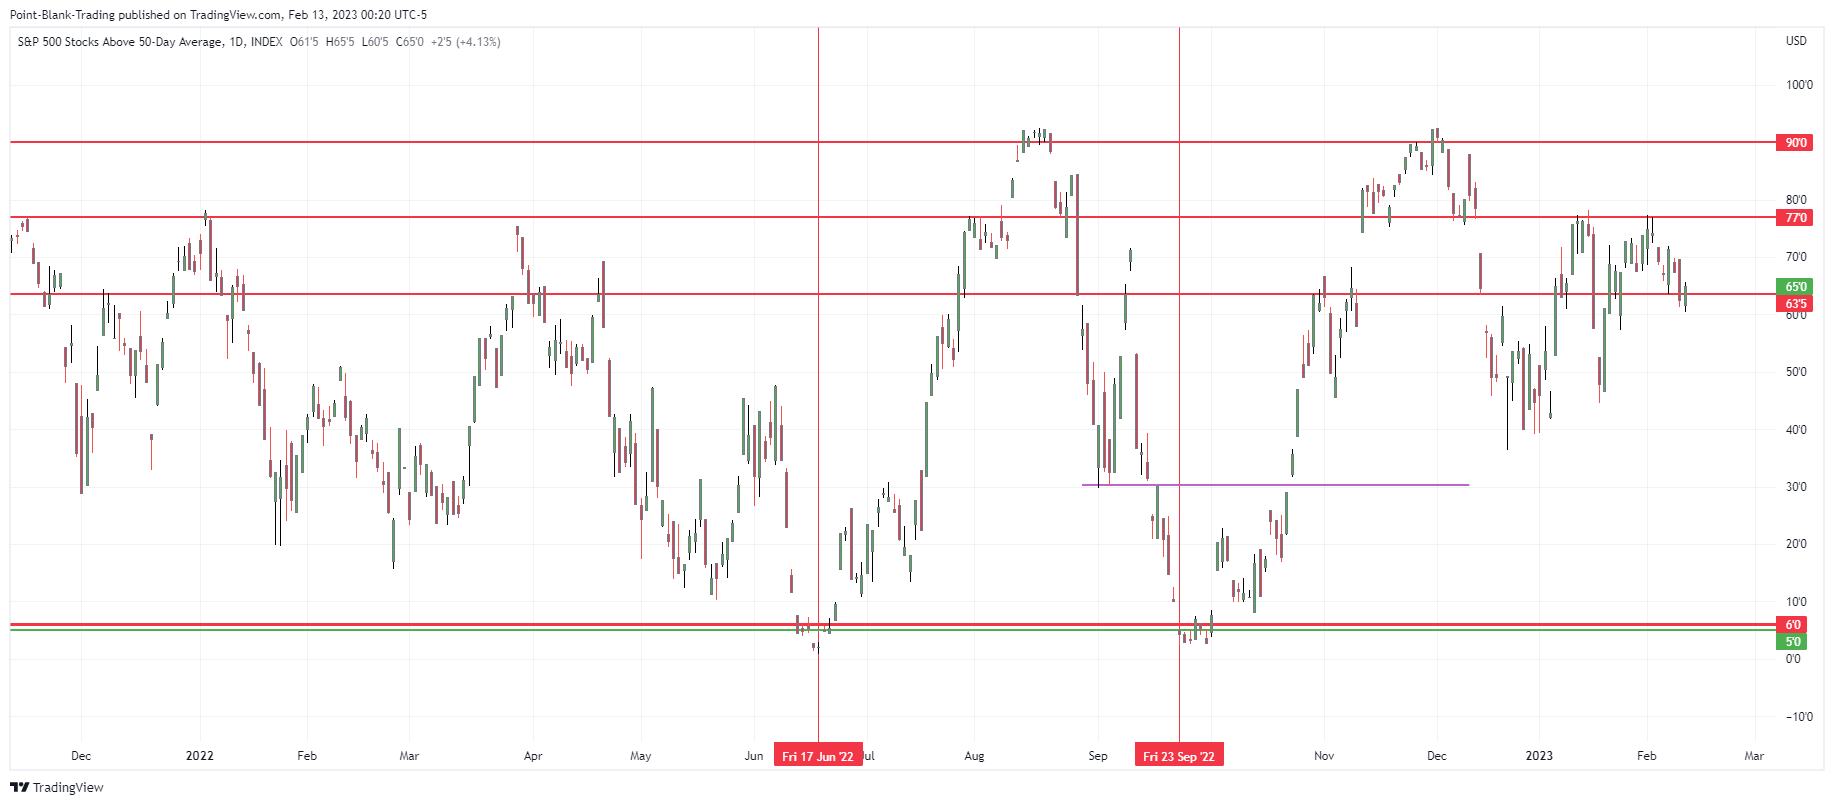
Overall these 3 indicators of the SPX's internal health are still positive and in a buy signal, it is important to monitor them on a daily basis for cracks that will anticipate a severe drop in the SPX.
DIA / DJI/ YM/ DJT
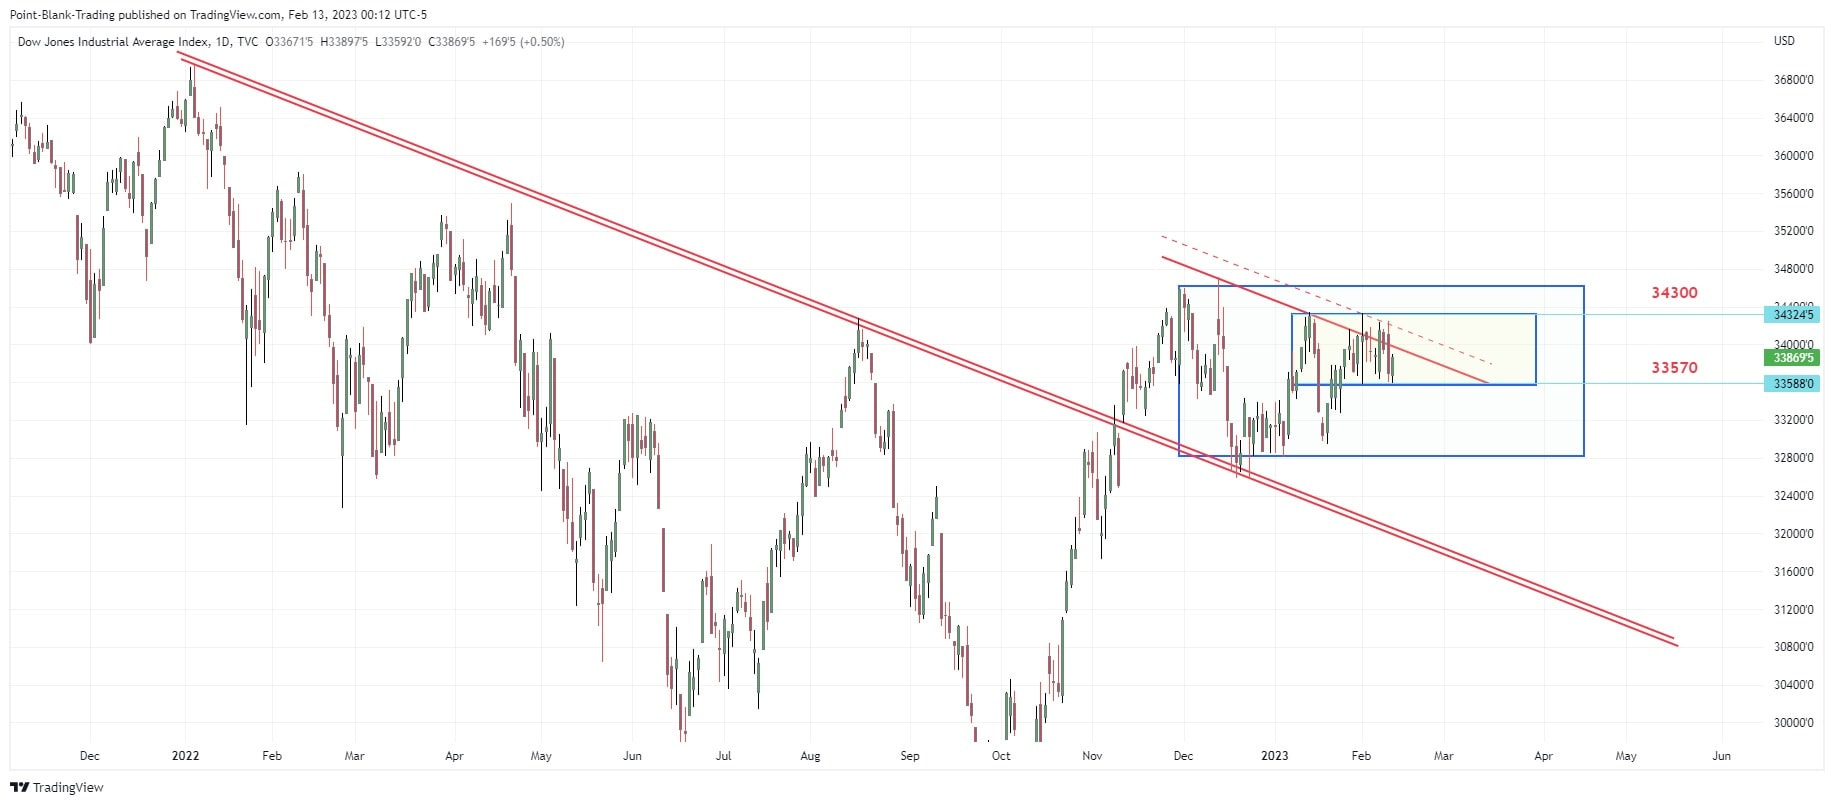
The Dow Jones closed Thursday below its 20DMA, but on Friday managed to bounce from its 50DMA and thus recovering the 20DMA. It closed Friday in positive territory with volume slightly above the previous one.
It is caught in a consolidation (a Noise Box) between approximately 34300 and 33570. Whichever direction it breaks it will remain a very interesting and easy trading opportunity.
It still looks in very good shape.
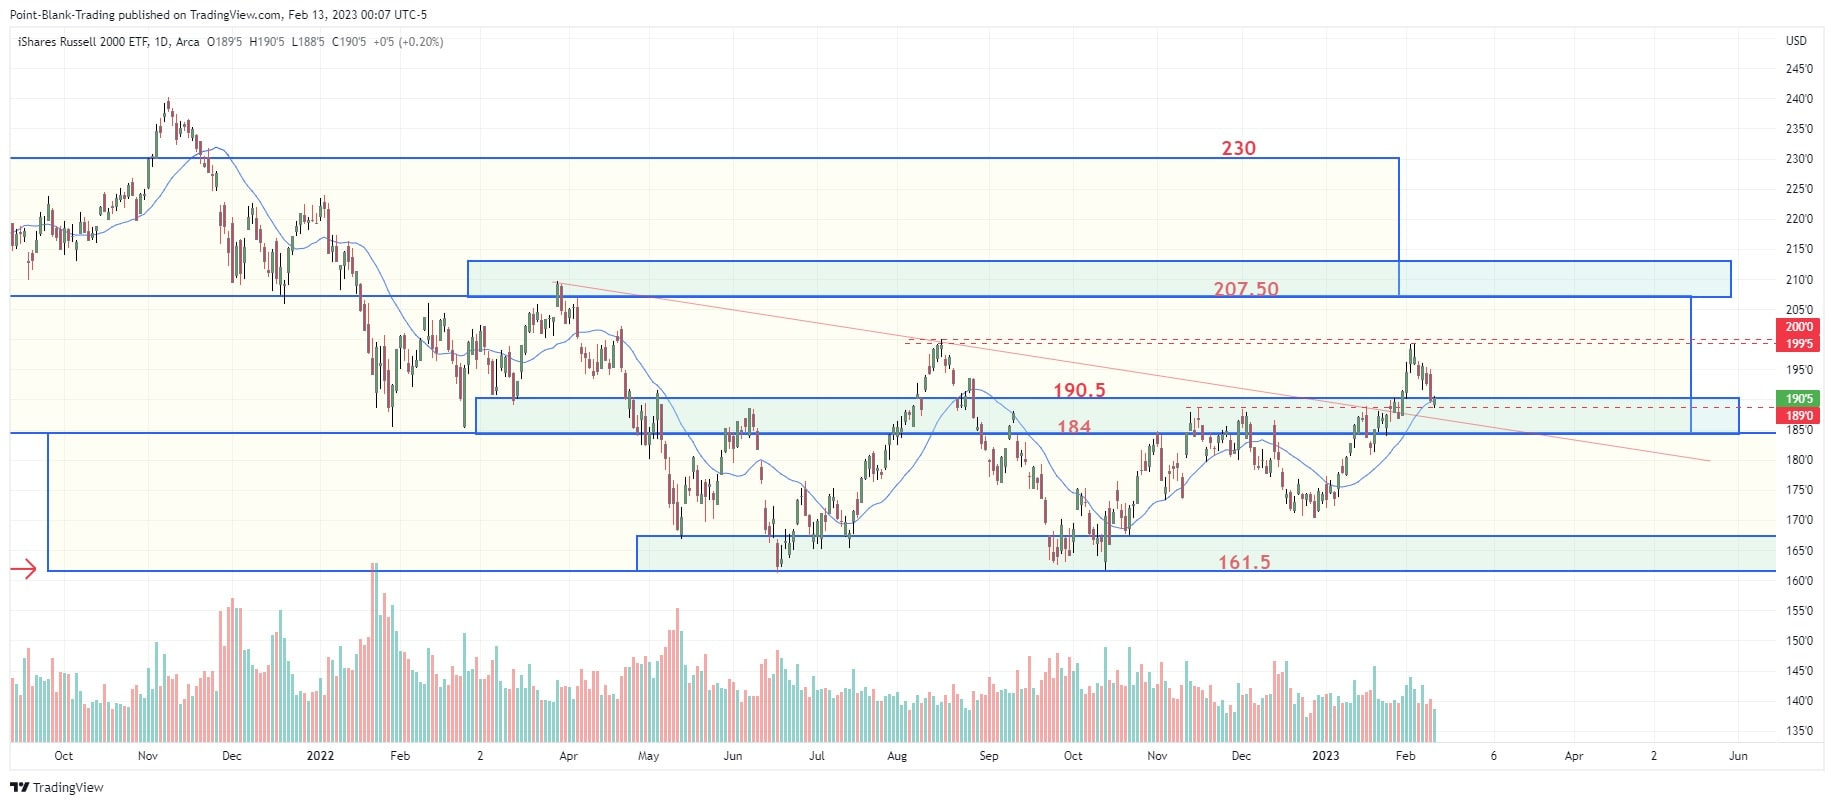
IWM / RUT / RTY
IWM is another index that recovered from initial losses to close positive, although it did so on low volume. The weekly chart closed lower on low volume and that is a positive thing, however it did print a bearish Harami candle in the weekly.
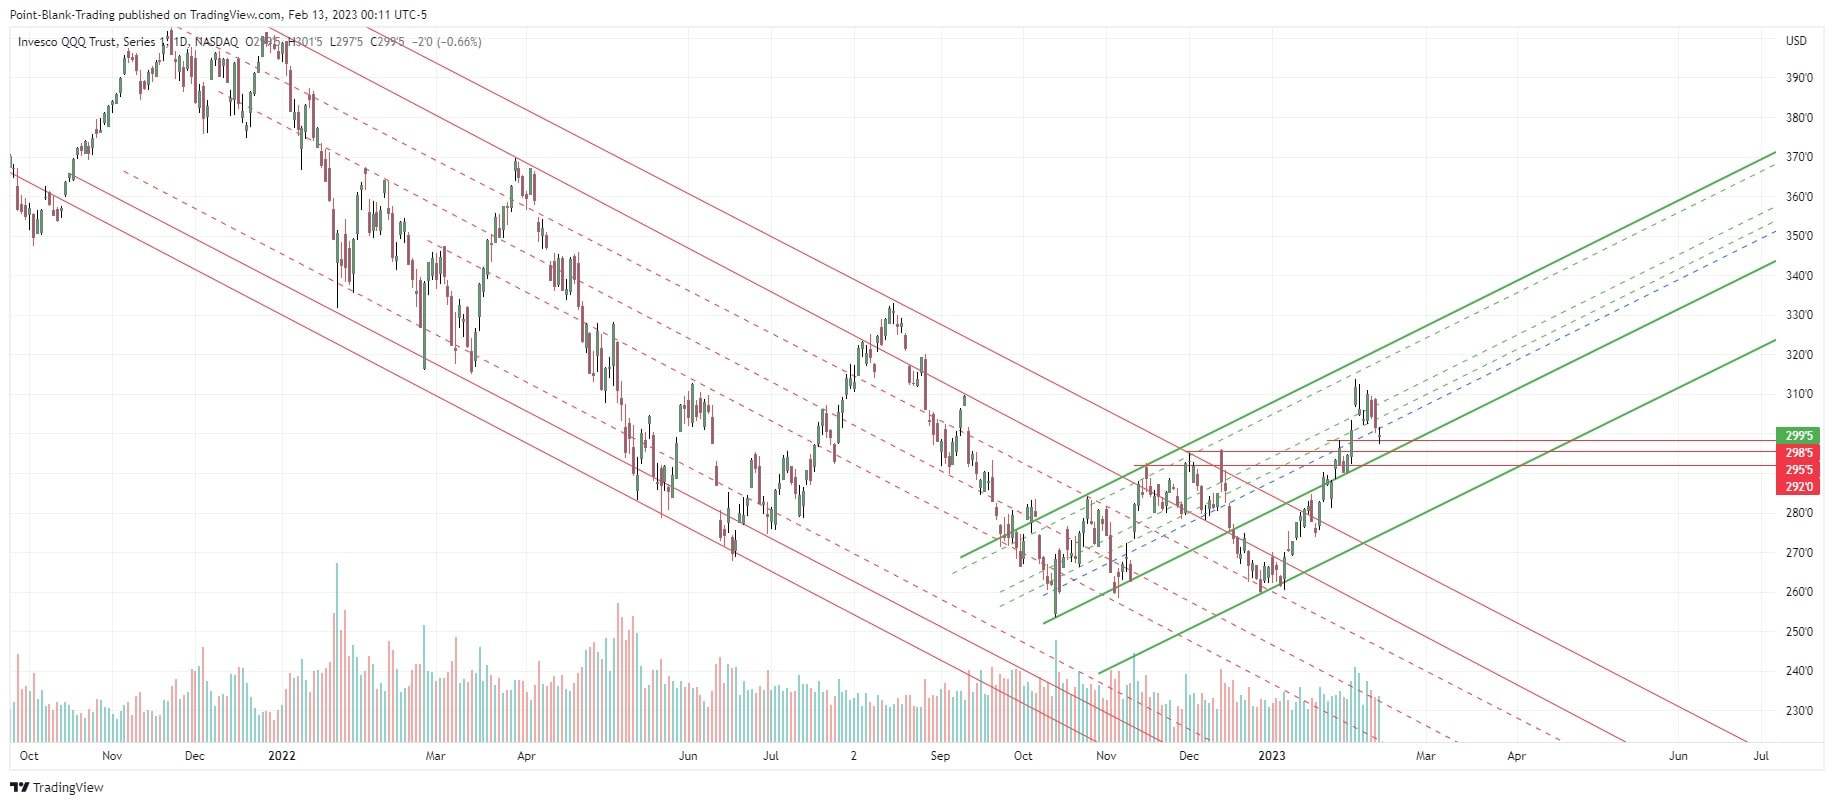
QQQ / NDX / NQ / IXIC
We will analyze the Nasdaq from QQQ's point of view.
It closed Friday with an apparently bullish doji. It did so on very equal volume to the previous day, but low overall.
It is above its moving averages. CCI gave a sell signal last Thursday and MACD is about to cross, but has not generated a sell signal yet.
NDX failed to test the breakout zone around 12000.
VIX / VVIX
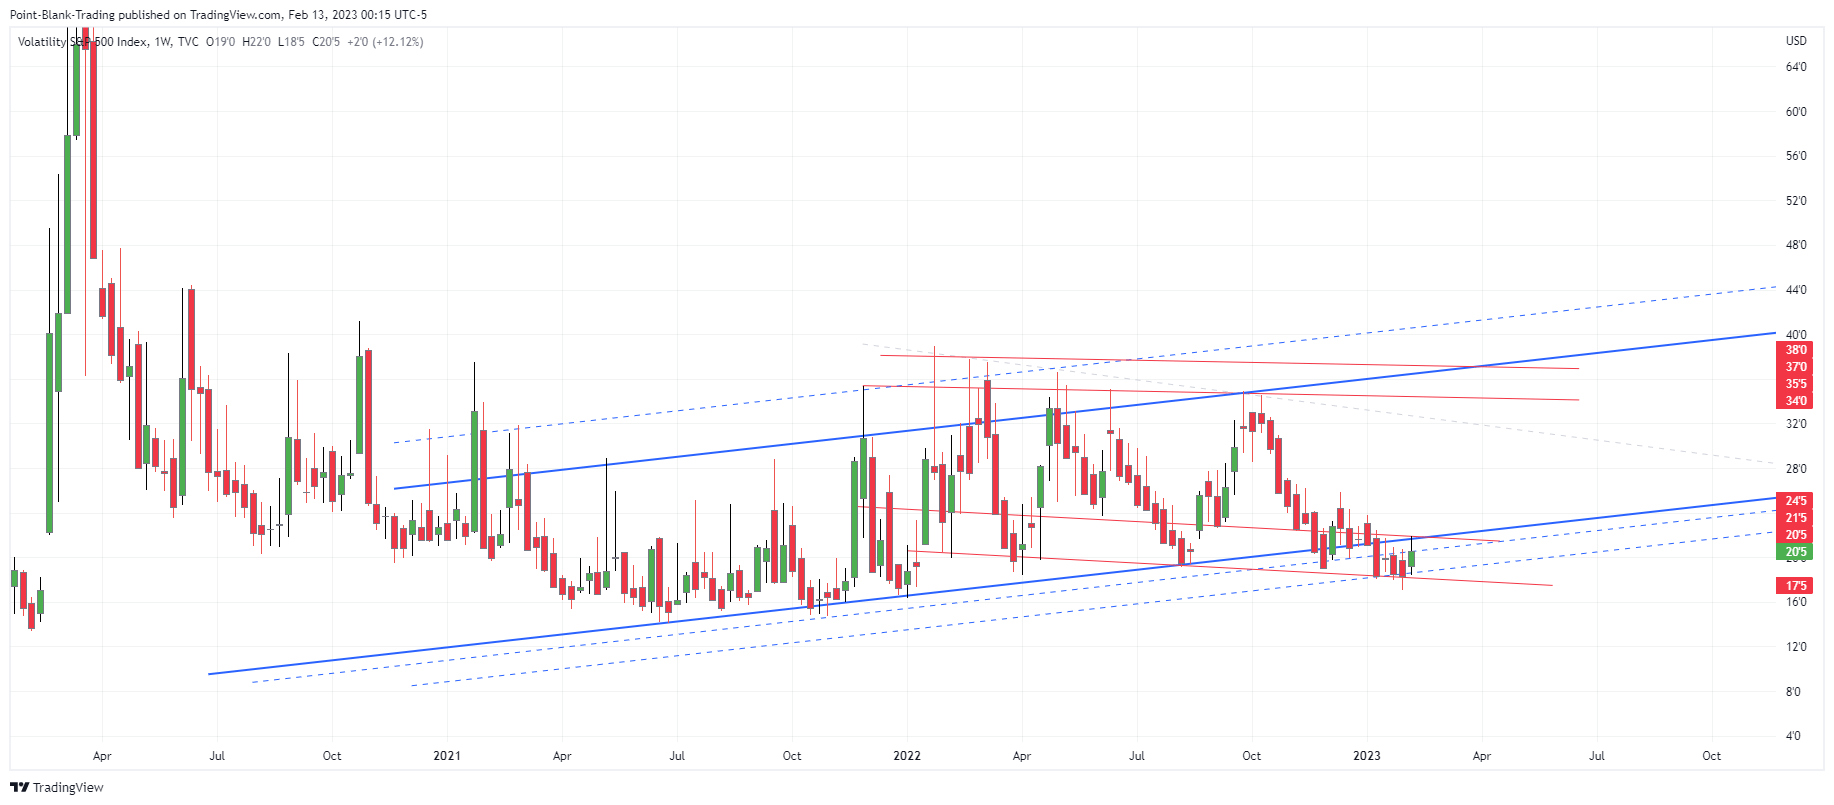
VVIX had a nice jump on Wednesday with a substantial gap up, managing to close with a gain of 12.07%. The move continued on Thursday when it was rejected from the top of the bearish channel it has dominated since January 2022. On Friday it was also rejected from that line. In conclusion, despite the great bullish attempt it is still trapped in the downtrend, that trend would change when it manages to break above that trend line, i.e. the top of the bearish channel.
Of course the breakout of that bearish channel would be a great bearish signal for the continuation of the SPX rally.
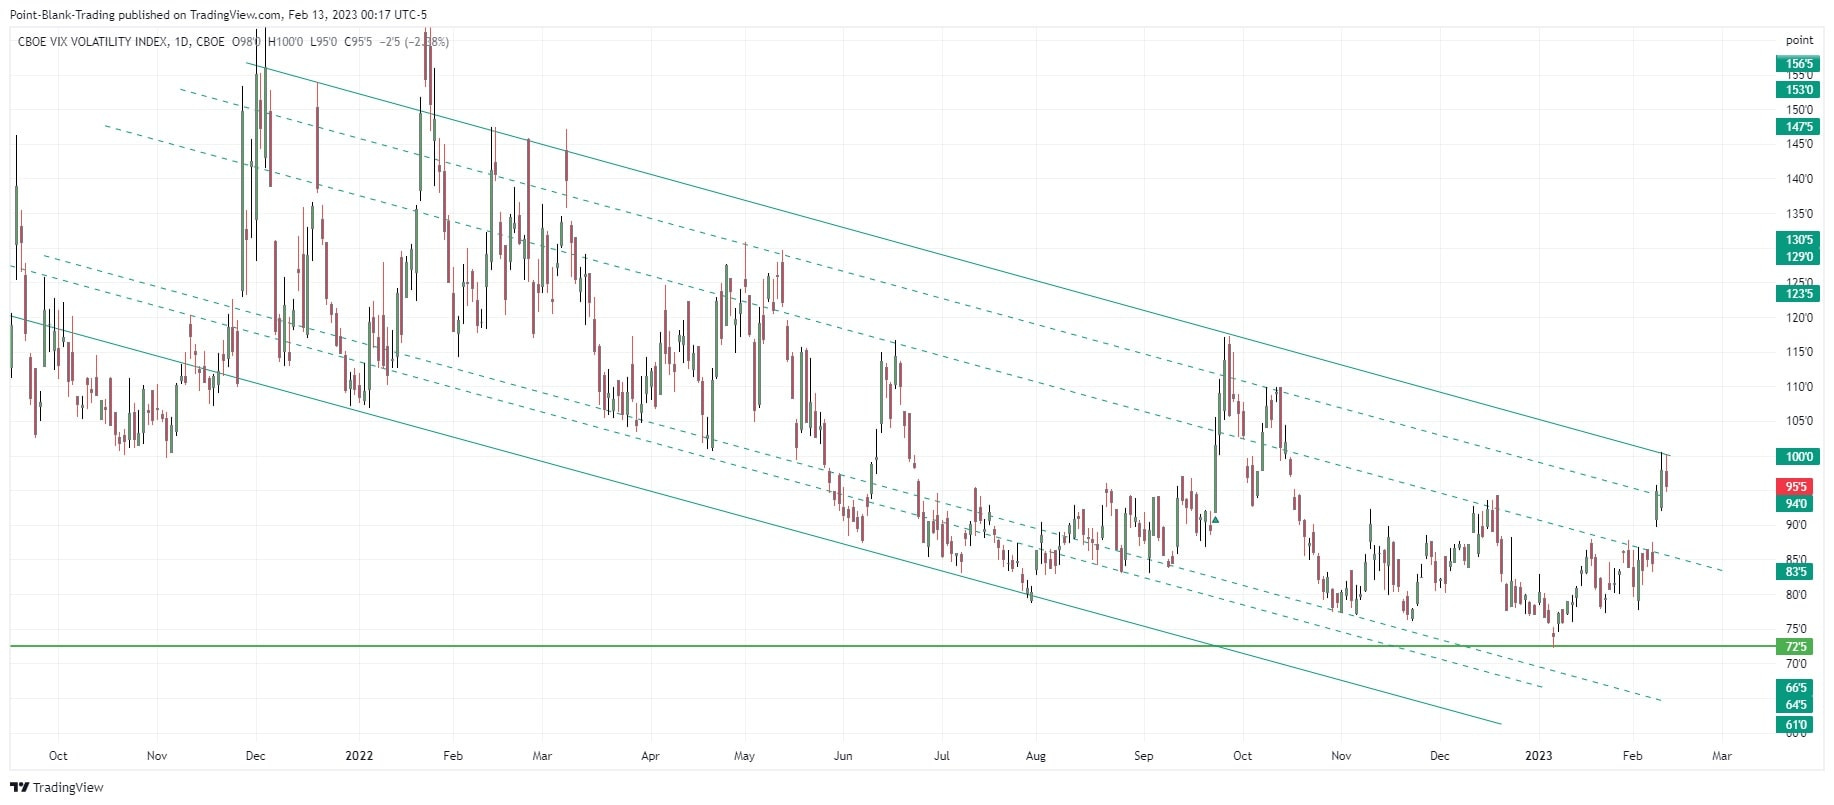
VIX also tried to make a breakout and start a rally, but was rejected from 50DMA which has lately done a great job of keeping it at bay. On Friday VIX printed a bearish Shooting Star candle. Despite that bearish candle, this week with the CPI, expect VIX to gain some life on Monday in a move that could take it as high as 23.5.
FAANG FXCM
The FAANG stock index accelerated its retest on Wednesday approaching its breakout zone, in doing so it printed a bearish 3 Black Crows pattern.
It closed a little below the October highs, but the December highs. Overall it is in a support area that it must hold and must in the next 3 trading days regain the territories above the October high or it will have sealed the beginning of a strong downward move.
3785

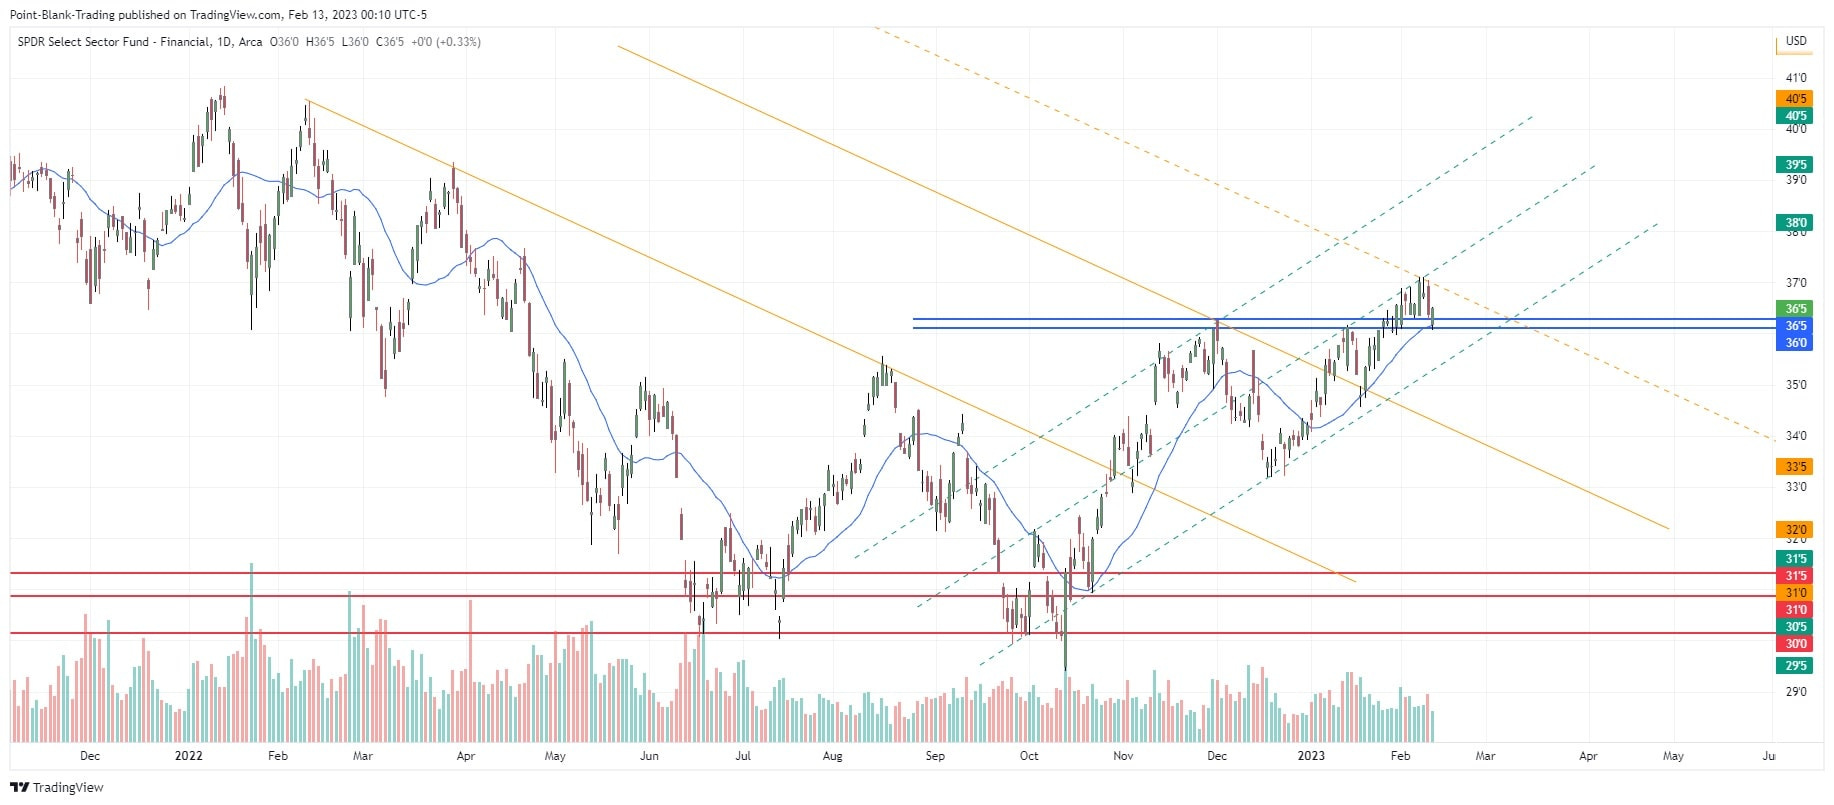
XLF
It retested the breakout line above the December highs and bounced from there on Friday, although it did so on lower volume.
The CCI generated a sell signal on Wednesday and the MACD on Friday.
DXY
It managed to bounce strongly from the 101.5 area and closed Friday slightly above the 50DMA, which puts it in a congestion zone or, what we call a noise box, between 103.5 and 105.5. That close also puts it above the mean of its long-term Regression Channel. This channel indicated a correction was mandatory when DXY was at 112.5. The short-term momentum is bullish.
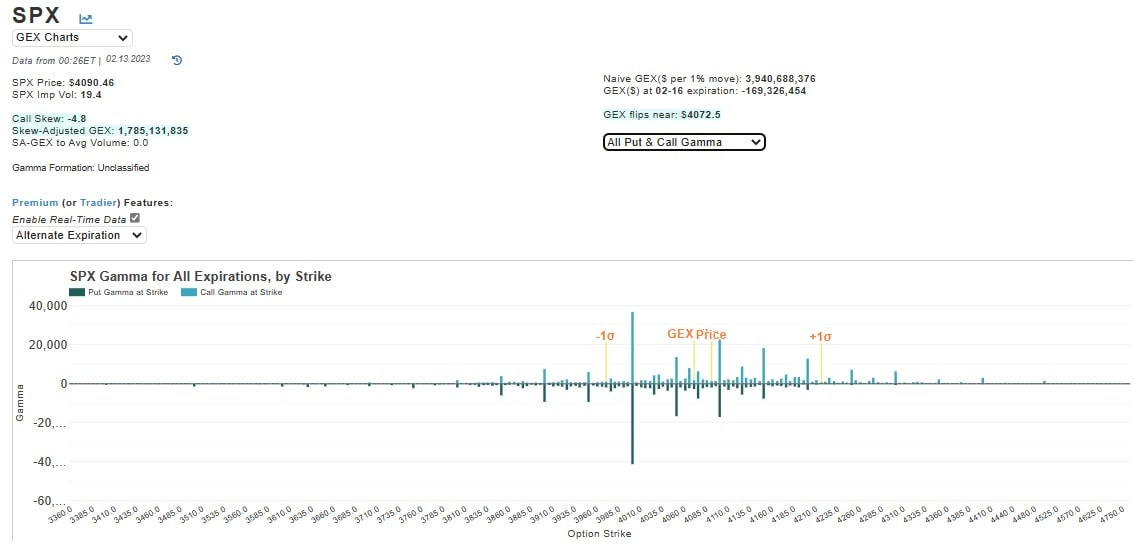
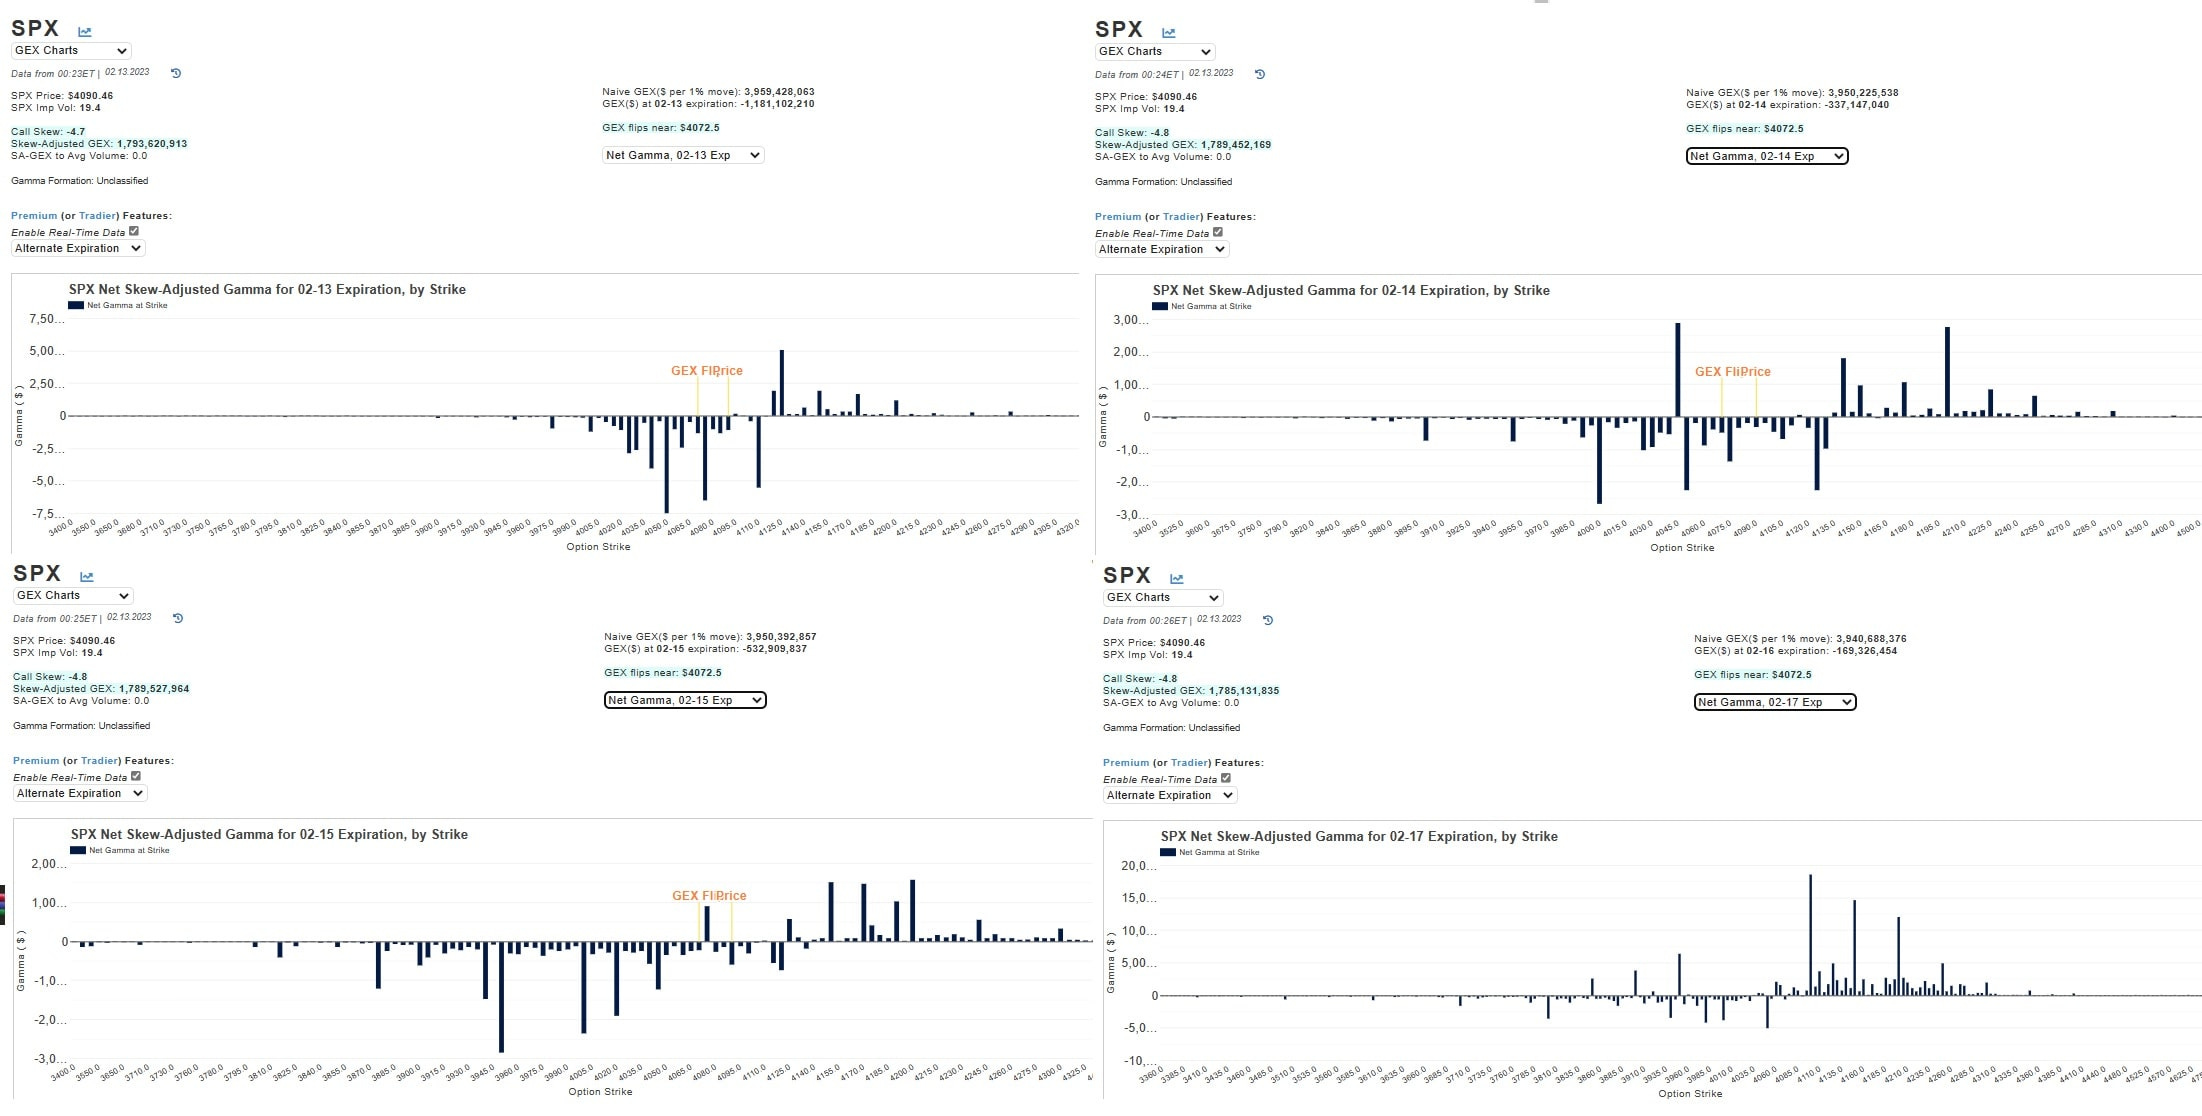
GAMMA/GEX
(Charts and data from @TradeVolatility)
Gamma presents a contradictory scenario this week. For example, Monday's GEX structure presents a mostly negative Gamma with the main stack at 4050, while Tuesday's with the CPI is quite erratic, showing trader indecision on where to place their bets.
In Wednesday's Gamma, ahead of Thursday's core CPI, we see a mostly negative Gamma where bearish bets predominate with the major stack at 3950, but then the Gamma for Friday paints an opposite scenario with the Gamma mostly positive with the major stack at 4100.
In the chart showing Gamma for all expirations by strike, bullish bets predominate and traders' focus is concentrated at 4000.
OUTLOOK
Although there are some bearish signals that force us to be very cautious and be ready to reverse our positions, we believe that as long as certain levels are not violated, the medium-term bullish trend will continue.
Undoubtedly the CPI number will have an important impact on the direction of the market. The number is expected to be down from the previous month, but would still be at very high levels that would support the higher rate scenario for a longer period of time.
The levels to watch are clearly defined on the charts. Here is what we will be monitoring:
•SPX 4074/4181. If the breakout is up the target would be 4300 and if the breakout is down the first stop would be 4000 with high probability of going quickly to revisit 3900.
•DJI 33580/34350. If the breakout is down the next stop would be in the 32820 area. Falling below the 2022 trend line and below 200DMA would be the major mark of a bear market. If it breaks to the upside the next immediate target would be relatively close at 34630, but this level would be breached and take us to strong resistance between 35500/35600.
•NDX 12000/12900. This index is further away from its breakout line than the previous ones. Just below 12000 is the 200DMA at 11930, the breakout of these two levels will confirm a new strong bear market bearish leg. If it the break is to the upside the next target would be at 13700.
•RUT 1886/2000. For all indices the breakout zone is more a band than a single line. RUT is at the first support band. The lower edge of that band is 1886. If the breakout occurs downward the first target would be 200DMA at 1820 and then 1725. On the other hand, a break above 2000 will target 2150.
•FAANG The FAANG stocks index from FXCM obtainable from Tradingview, is already at very important support. It should bounce from there on Monday, failure to bounce would be a failure of the retest of its breakout line. Below it has 200DMA at 3691 and then the important breakout level at 3641.5. A drop in this index below these levels is very nefarious for the overall market. If the breakout occurs through the upside 4071 would be the first major resistance followed by 4345.
CONCLUSIONS
It's a week to be patient. As we posted on Twitter SPX may try to move towards the top of the Noise Box located at 4181 in anticipation of the CPI announcement on Tuesday. If we wish to trade with greater accuracy and confidence we must arm ourselves with patience and wait for the markets breakout to one side or the other of the aforementioned levels.
A rise of VIX above 23.5 or DXY above 105.5; a fall of FAANG below 3691, RUT below 1820, DJI below 33580, or NDX below 11930 would be the mark that a new leg of the bear market is beginning. Watch for this.
We do not yet believe that we are, as some indicators or analyst say, at the beginnings of a new cyclical bull market, but we do believe that as long as the charts do not indicate otherwise the medium term momentum is to the upside. Certainly the macro scenario is very discouraging, but as we already know the market many times walks on its own feet and not on fundamental drivers.
Trade carefully, patience will pay off handsomely.