


Comparing the leaders
A look under the hood, part 2 - July 9-2024

Linear Regression Channels
Linear Regression Channels
In our newsletter yesterday (Is the market in good health?), we studied the different market breadth indicators of the SPX and NDX. We know that the market breadth has been very poor and that there are only a handful of stocks, the Mag7, pulling uphill the thousand-car train that is the market.
In this special bulletin, we will compare the Mag7 to try to discern how much further they can continue to advance. To have a similar benchmark that allows us to measure them all equally, we will use one of our favorite tools: Linear Regression Channels. During this process, we will also analyze the indices.
Before discussing the use of Linear Regression Channels, it is important to mention that we have selected 434-period LRC for this study, applied on daily charts. This time choice allows us to cover the entire uptrend from the October 2022 lows.
These channels are built from the "Best Fit" line, which represents the line that best fits all data points, it will be the mean of the channel. Subsequently, parallel lines are added above and below to form bands of 0.5 standard deviations each. Although we typically construct channels with bands of 1 standard deviation, the granularity of 0.5 standard deviations allows us to more precisely identify key support and resistance levels.
The channel width ranges from -3 stdev to +3 stdev. The "Comfort Zone" lies between -2 stdev and +2 stdev, where at least 95% of price variations should occur. It is essential to remember that these channels are a non-cumulatively representation of the normal price distribution of the corresponding asset.
As dynamically calculated lines on each bar (or candle) of the chart, when the asset volatility increases, the bands expand, and vice versa. The adjustment speed depends on the channel's timeframe; short-term channels adjust more quickly to volatility changes than long-term ones.
The channel's mean (central line of the channel) represents a crucial support and resistance line. The asset is considered strong when trading above this mean and weak when trading below it.
The lines delimiting the bands, especially those marking the whole units of standard deviations, -3, -2, -1, +1, +2, +3, are essential support and resistance levels that we use to establish our targets, and relevant support/resistance levels.
When an asset breaks out of the Comfort Zone or the channel in the direction of the trend, it indicates strong momentum in that direction and the need for a reversion to the mean. If breakouts occur opposite to the dominant trend, it could suggest a trend change in progress, and more movement in that direction can be expected.
By breaking out of the Comfort Zone or leaving the channel driven by strong momentum, the asset may initially find support (resistance) at the channel's edge or the Comfort Zone, but eventually, this support (resistance) will be broken.
It is common to observe that when an asset exits the Comfort Zone or the channel in the same direction as the dominant trend, upon reverting to the mean, it commonly goes all the way to the opposite band, for example, from -2 stdev to +2 stdev or from -3 stdev to +3 stdev.
At the bottom of the chart, we have our slope indicator, which indicates whether the channel is ascending or descending. We use a 60-period timeframe for this indicator. A value below zero suggests a negative slope in the 60-period regression channel, and vice versa. A reading of zero indicates that the 60-period regression channel (not shown) is horizontal.
This custom indicator is publicly available and can be found on TradingView under the name Enio_LR_SlopeMC.
SPX
SPX After falling outside the channel to almost -3.5 stdev in October 2023, SPX reverted to the mean, and surpassed it reaching up to +1.5 stdev in March-April of this year. From there, it started a pullback that broke below the mean and dropped to -1 stdev, where it found support and bounced, initiating an uptrend that has generated an extraordinary gain of about 600 points until last week, closing near the strong resistance of +2 stdev at 5585 on Friday. Pay attention to this level.
Its Slope Line crossed above zero in November of last year and is currently well inclined upwards, indicating a strong bullish trend for SPX
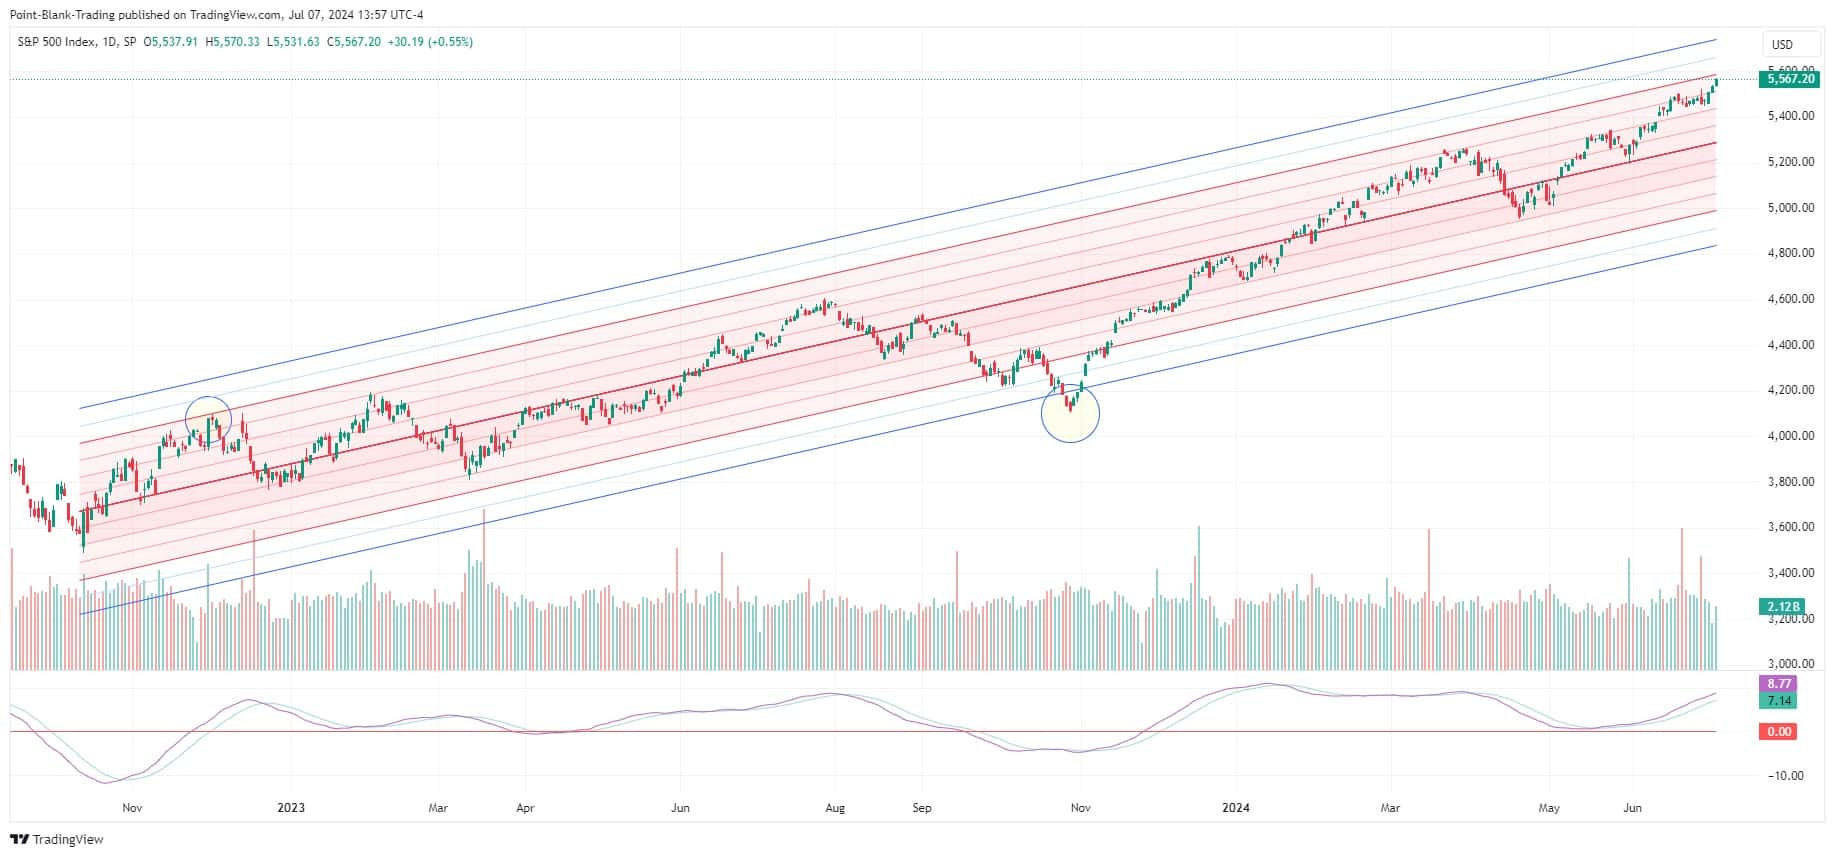
.
NDX
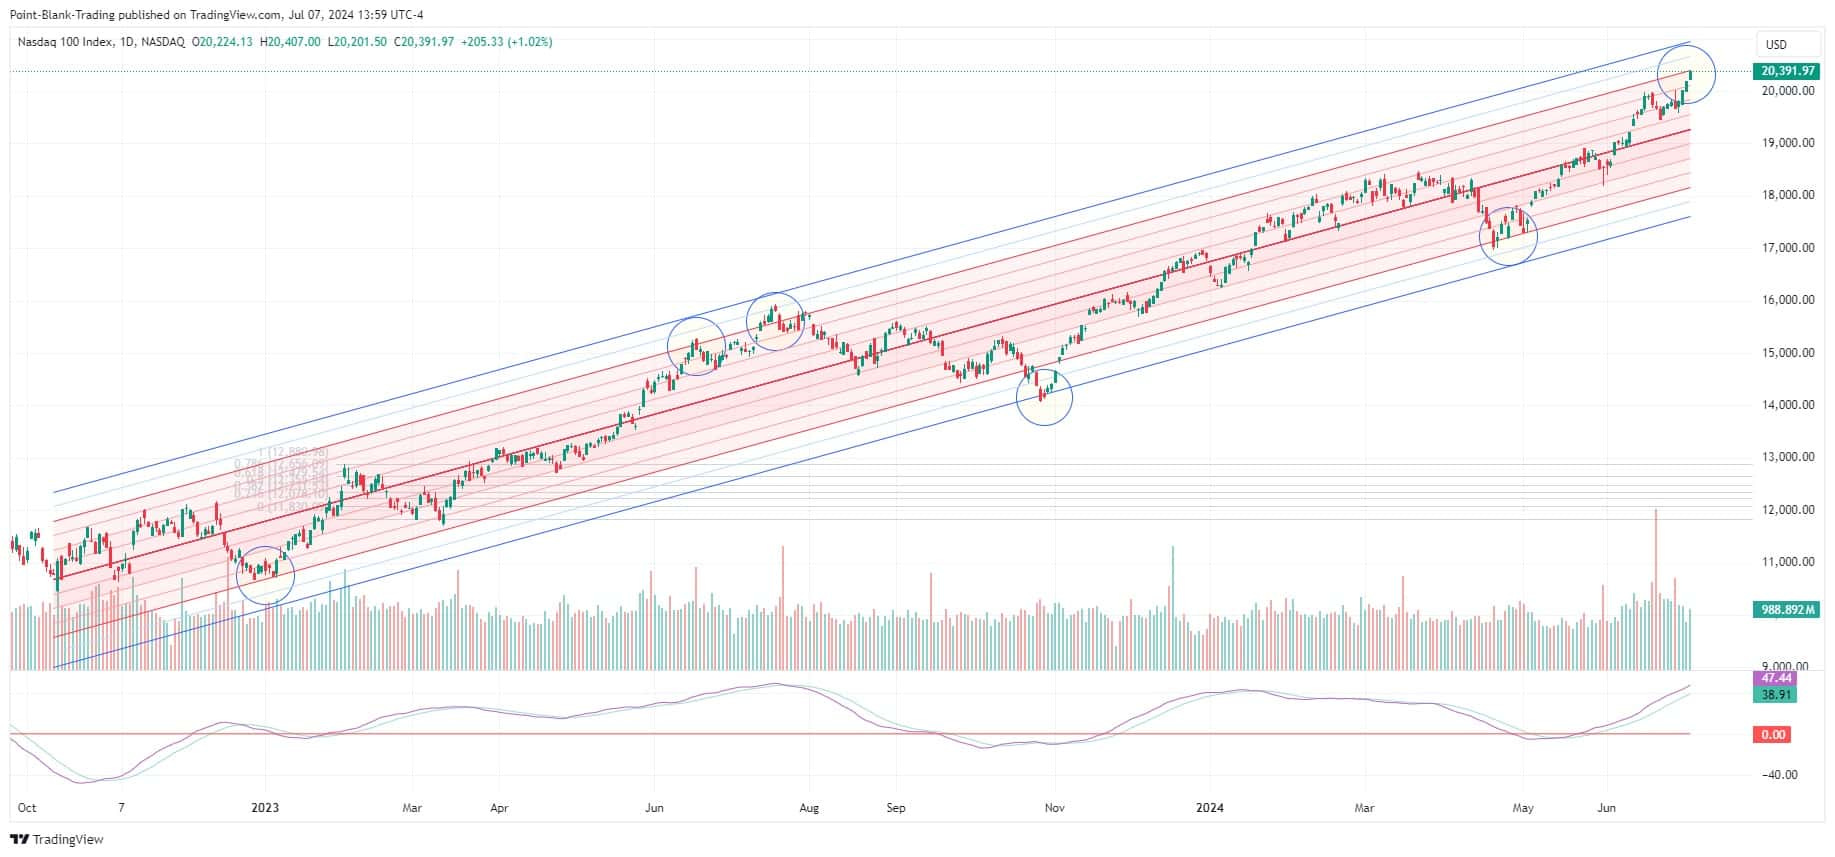
The NDX has exited the Comfort Zone and the Regression Channel several times, with both upward and downward movements, ultimately followed by mean reversion. On Friday, the NDX closed right at the upper edge of the Comfort Zone (+2stdev) at 20390. This is typically a significant resistance level, so close attention should be paid to price action at this level. If NDX repeats past behavior, a reversion to the mean is a safe bet.
The Slope Line briefly crossed below zero in April, but it is currently very steep, pointing upwards and nearing a historical high. This indicates strong momentum for the NDX.
DJI
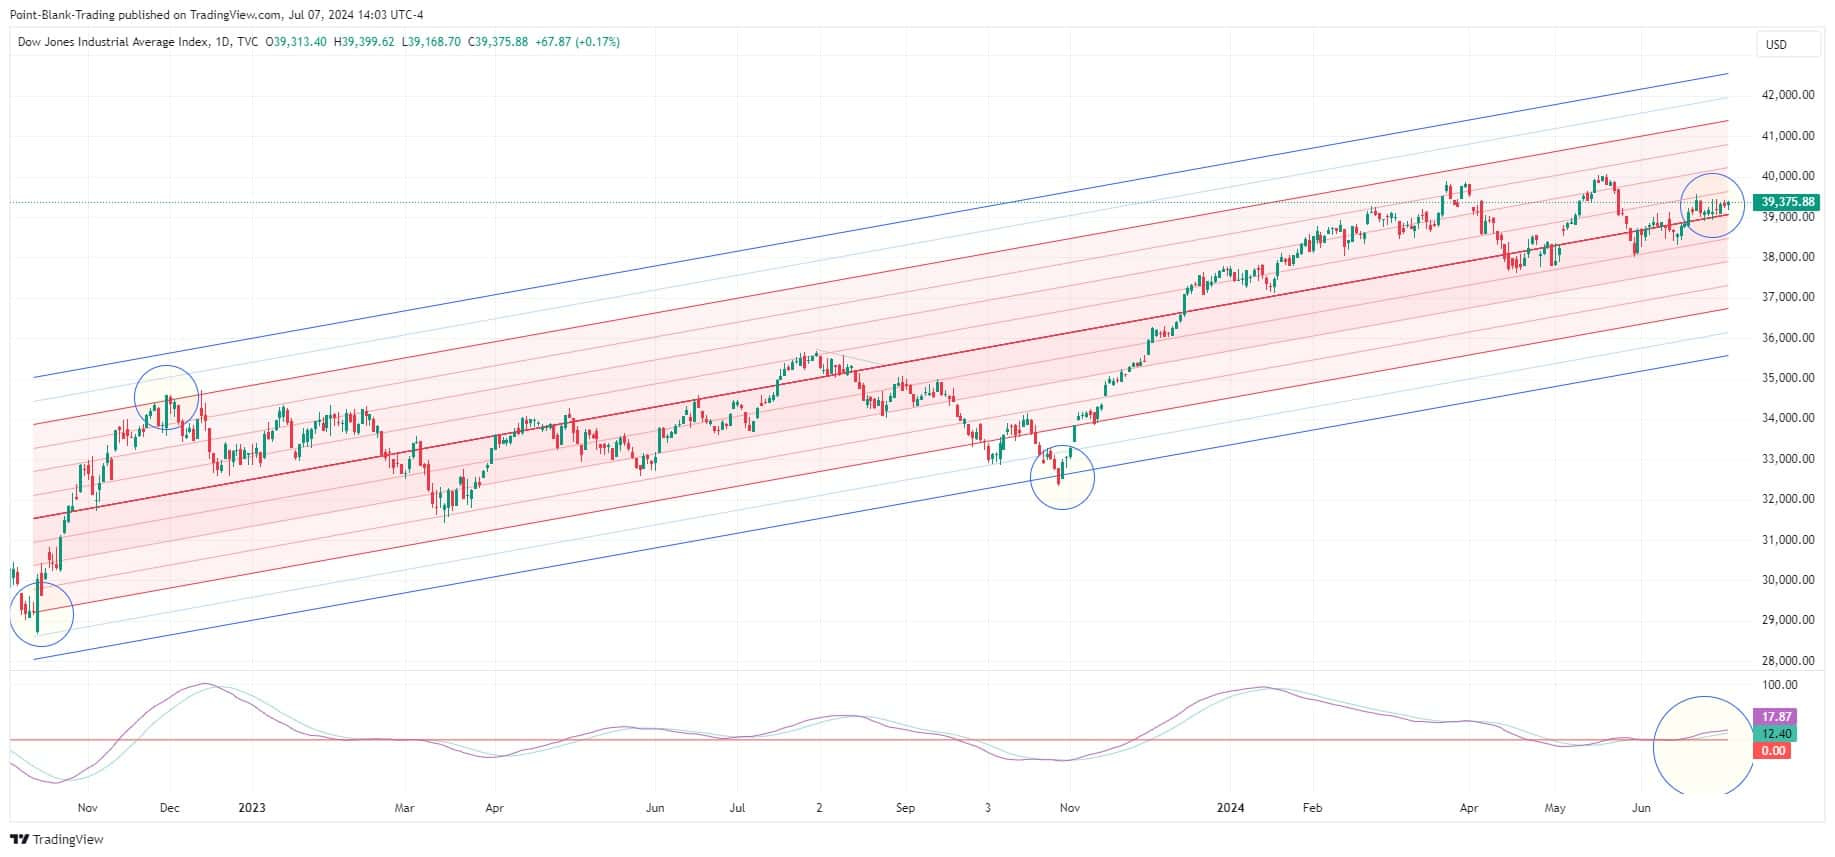
The Dow Jones Industrial average has struggled to keep up with the bullish pace of SPX and NDX; however, to its credit, it crossed decisively above the mean of the LRC on June 20th, and since then, the mean has provided support, this action suggests DJI is ready to continue advancing.
Its Slope Line crossed above zero on June 18th, and although not as steep as those of SPX and NDX, it also points upwards, signaling intentions to move forward by DJI.
AAPL
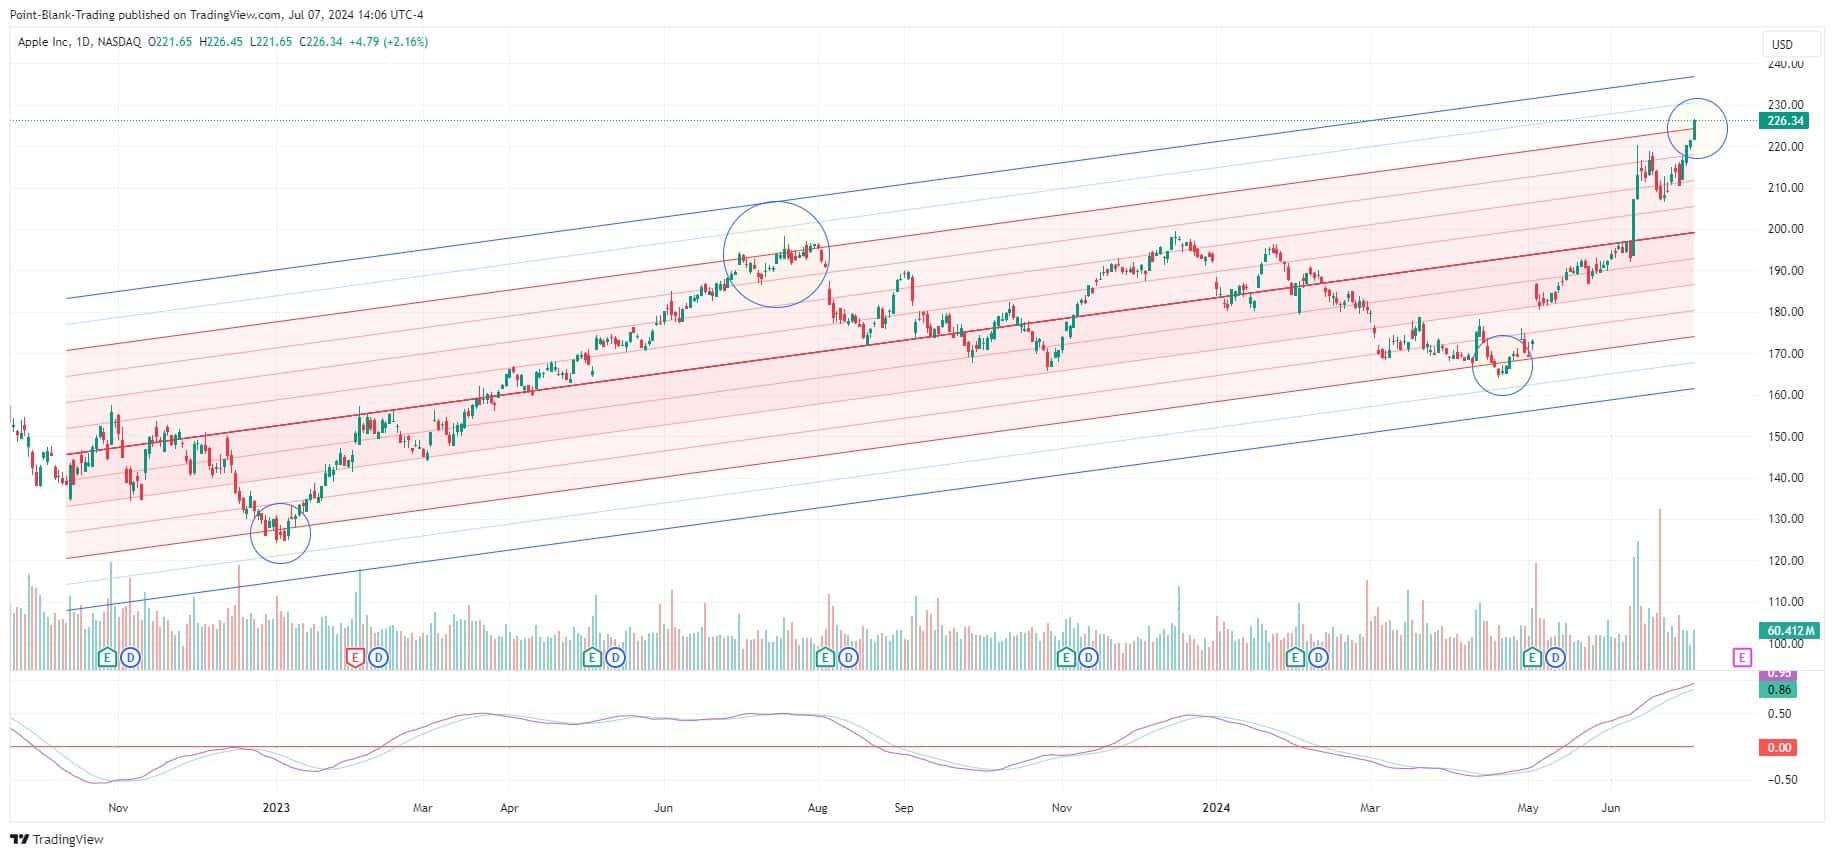
During this uptrend, AAPL has broken above and below the Comfort Zone in several opportuinities, always ending reversing to the mean.
On Friday, once again AAPL broke above the Comfort Zone, and while this indicates that it has strong upside momentum, but it also means that at some point it will reverse to the mean. Currently resistance is at 230.70, where the +2.5stdev line is. The main resistance is above at the +3 stdev line, currently at 237.
Its Slope Line crossed to positive on May 15, printing an all-time high last June 24, marking the biggest upward momentum in AAPL's history. As we mentioned in the previous paragraph the upside momentum is strong, and may continue, but at some point AAPL will begin its reversion to the mean.
META
META has successfully bounced several times from the lower edge of the Comfort Zone. Since its large post-earings gap down on April META started a road to recovery, managing on Friday to solidly move above the mean of the channel, simoultaneously printing new ATH.
Prior to the gap down, META spent two month playing around the upper edge of the Comfort Zone. That kind of action is typically seen when an asset is driven by a very strong upward momentum, but almost always the move ends with a reversion to the mean, unless the asset breaks out of the channel or the CZ and stays outside long enough for the channel to widen due to the increased volatility. Keep present the lines are calculated and drawn on each bar or candle. The width from the mean to the 1stdev line is exactly the equivalent of one Standard Deviation of the asset for the same time frame of the channel.
META's slope line crossed above zero on June 27th and is very positive. META has more upside ahead
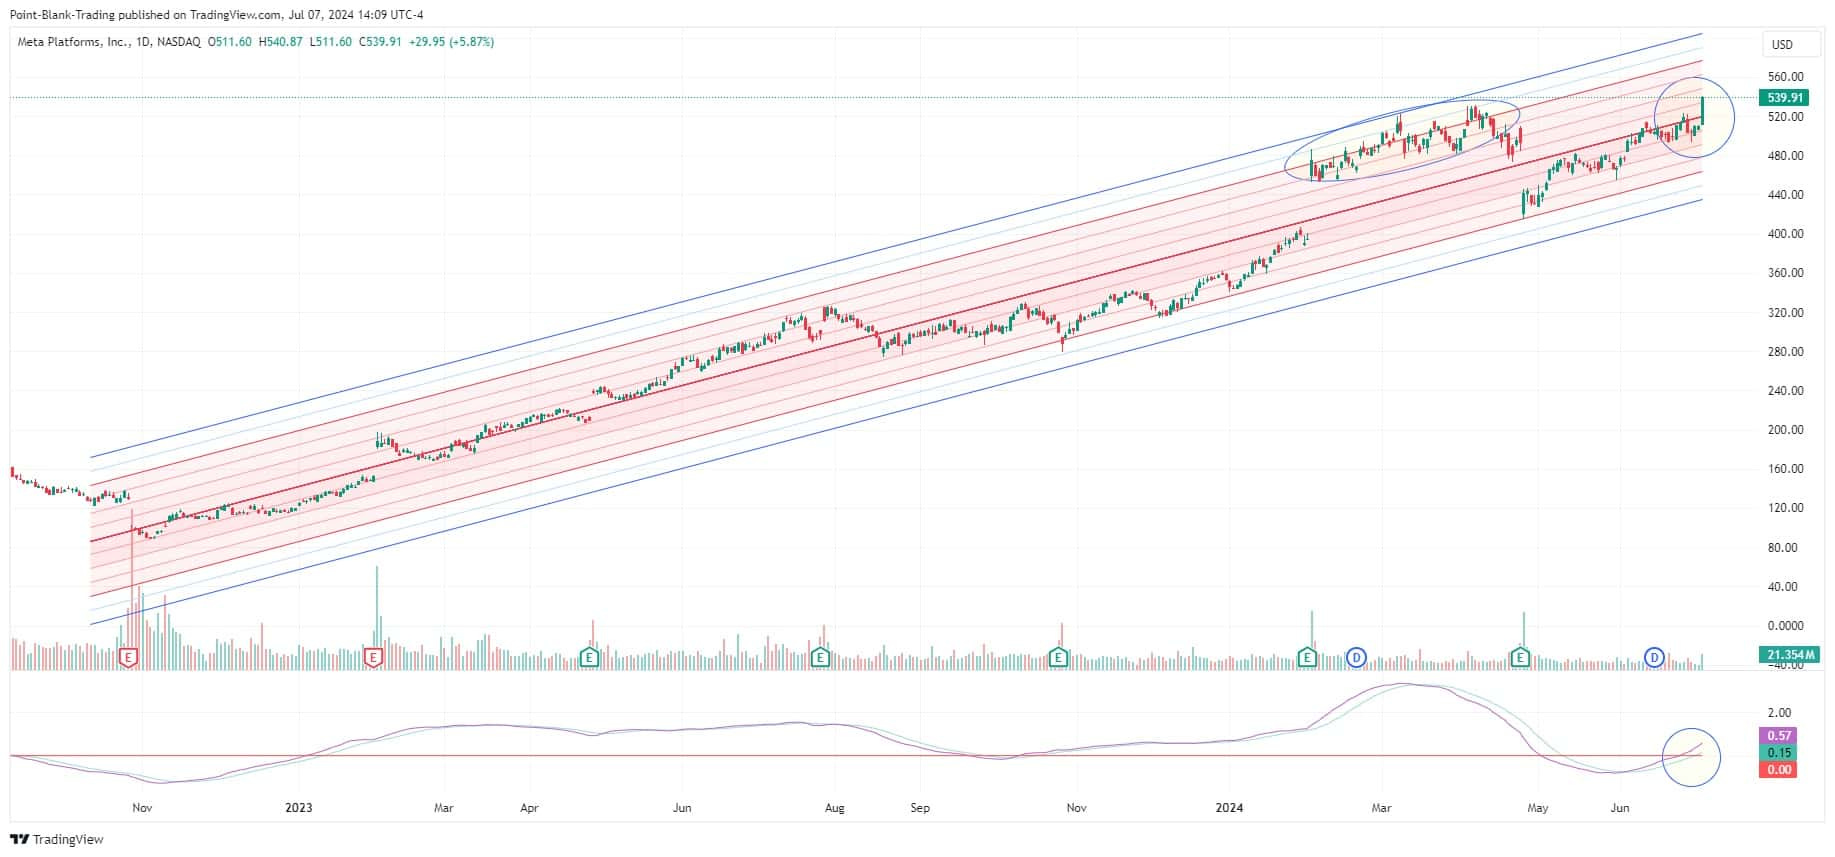
.
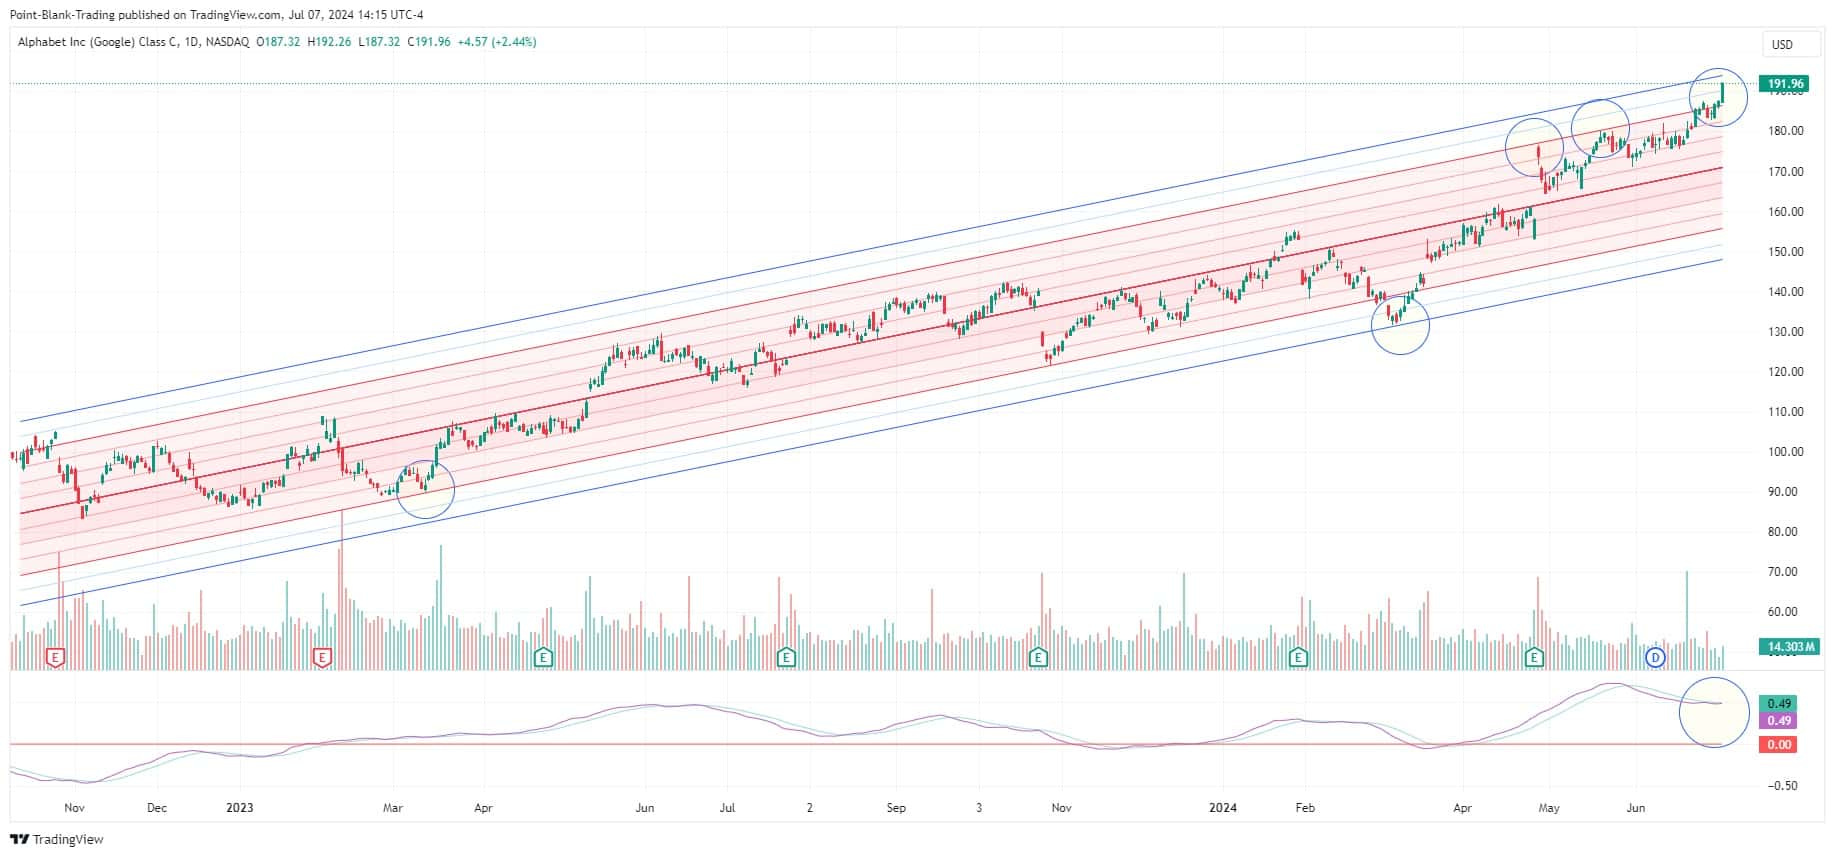
GOOG
GOOG has been respectful of the Comfort Zone boundaries, every time it has touched its edges or broken to the upside it has reversed to the mean. Last Friday it closed outside the Comfort Zone for the first time since October 2022. There is significant resistance at the +3stdev line currently at 194.
Its Slope Line is somewhat flattened after having been pointing down. It seems it wants to reverse that trend, but a pullback is expected. However, if its upward momentum remains strong then the upper edge of the Comfort Zone, the +2stdev line -currently at 186- could stop that pullback, and GOOG would bounce from there to stay out of the channel a little longer. In the end a reverse to the mean is in order.
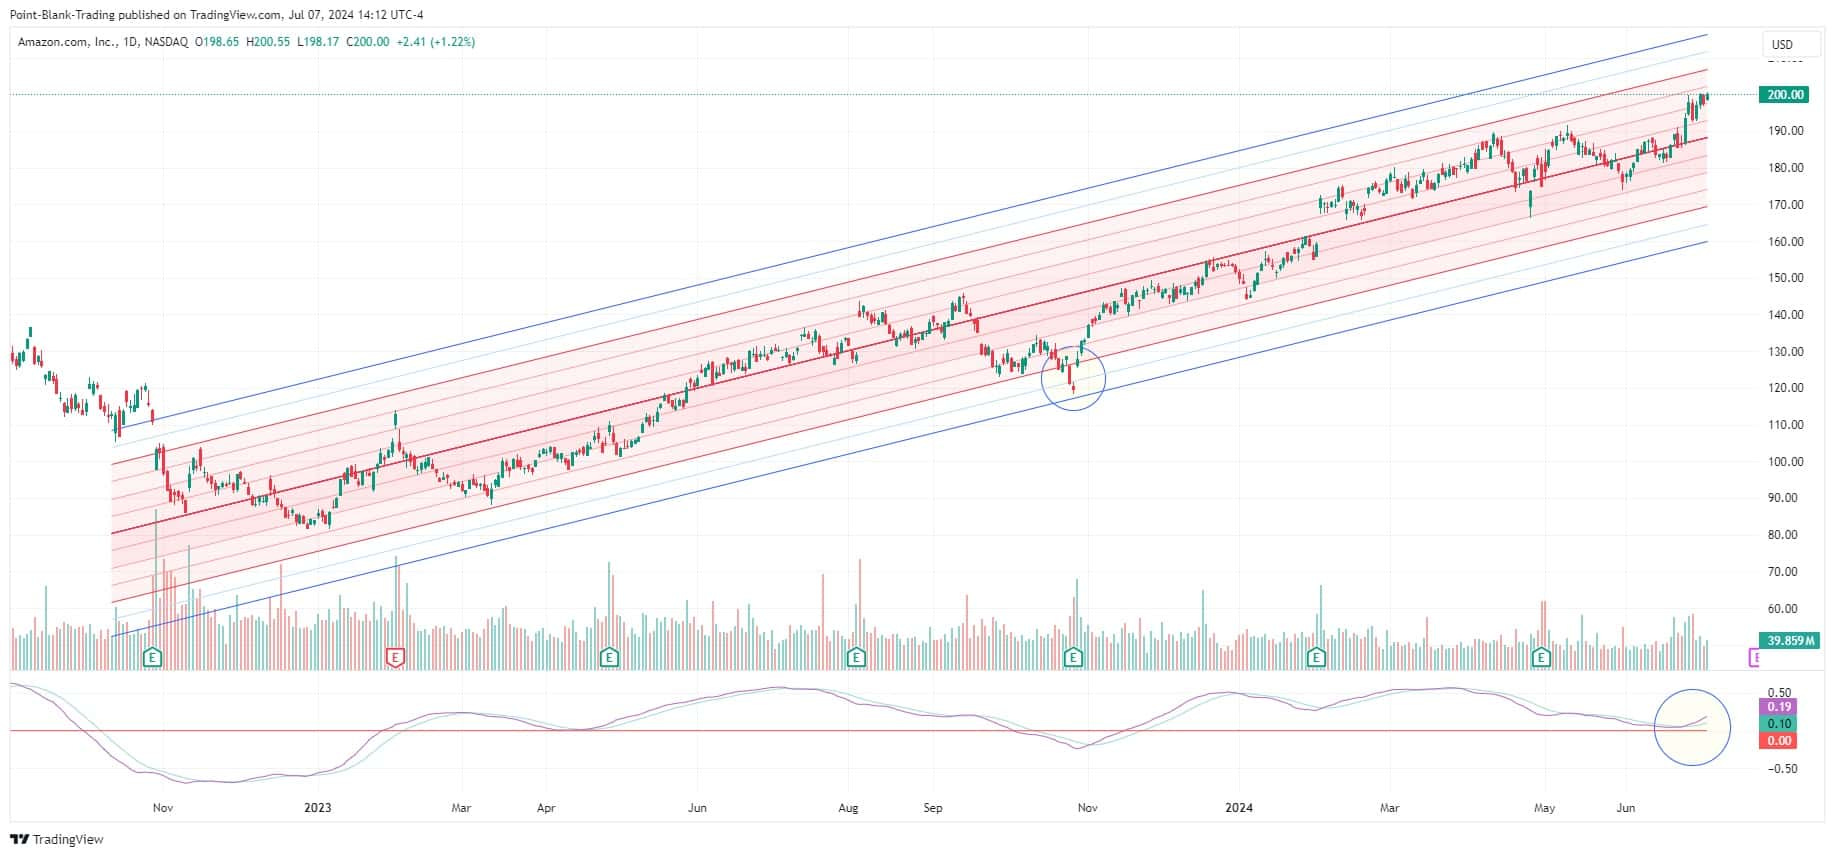
AMZN
During the uptrend since October 2022, Amazon failed to reach the top of the Comfort Zone. This suggests weaker upward momentum and lower growth compared to the others in that period, with only TSLA showing lower growth. On June 26, it experienced a strong push from the channel mean and has been gradually moving higher since then. The +1.5 stdev line that has acted as resistance, and is currently at 202.60.
Its trendline was one of the few that did not fall below zero during the April correction this year. Currently, its support and resistance line is quite vertical and pointing upward, indicating solid bullish momentum.
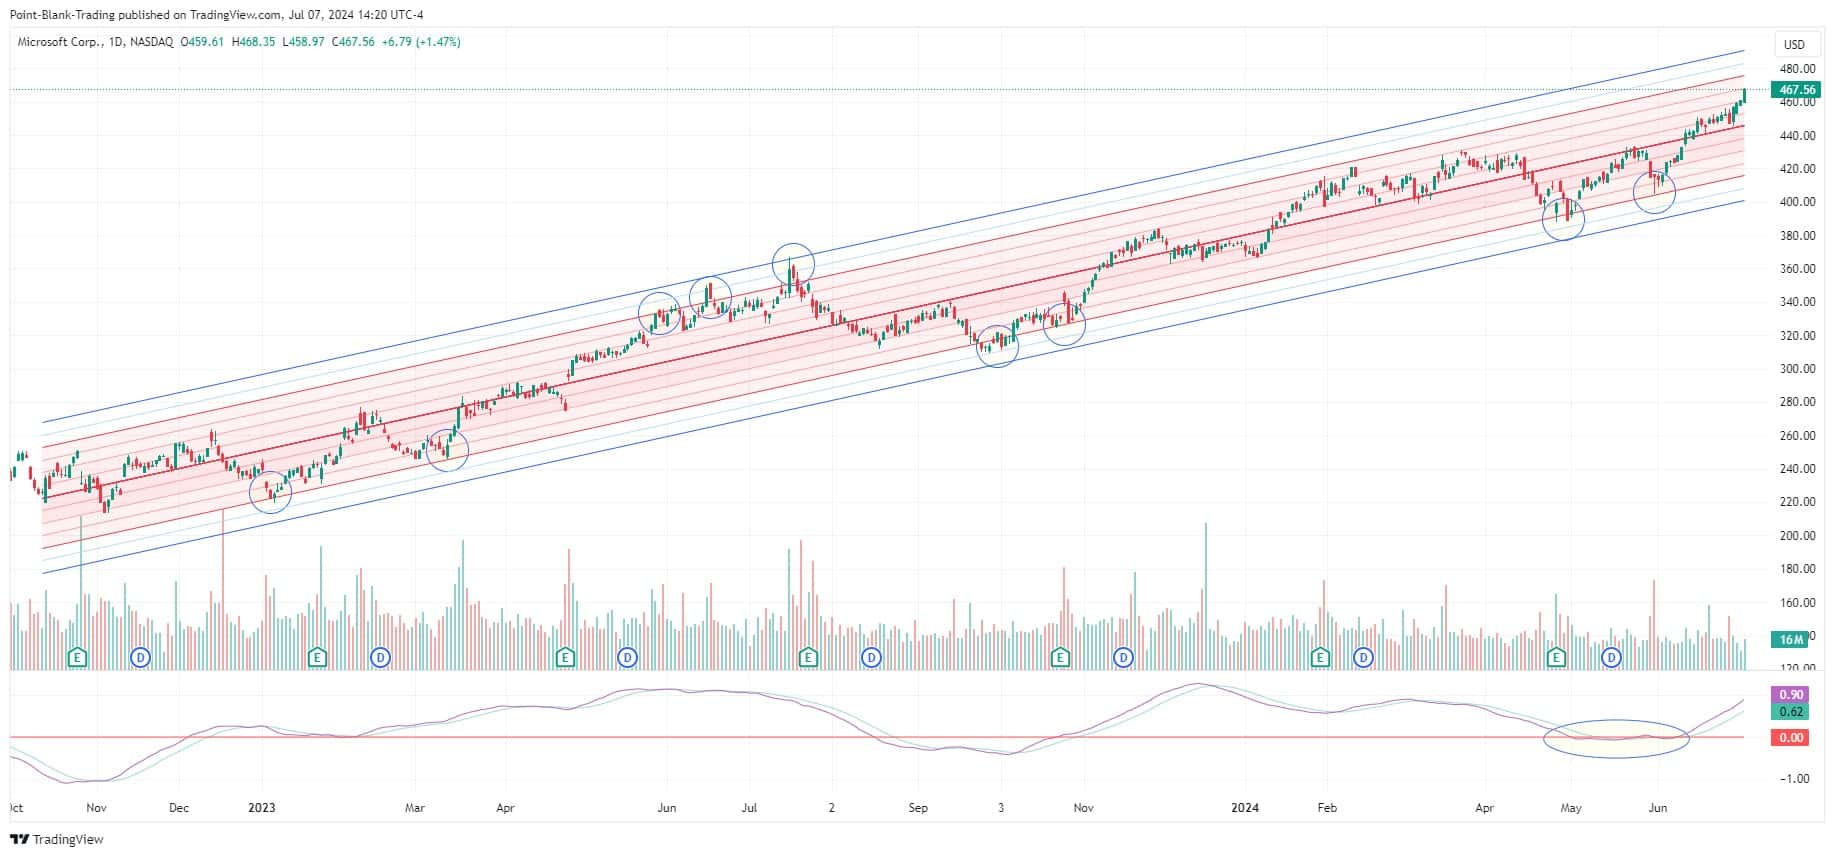
MSFT
MSFT has exited its Comfort Zone several times since October 2022, experiencing minor pullbacks and retesting that line. Eventually, it underwent a correction, similar to what we saw with AAPL, leading it to cross all the chanel to the lower edge. Although MSFT has surpassed the upper channel edge several times, it has not breached the lower border since 2022. Last Friday, MSFT closed at the 1.5 stdev line and still has room to advance towards the channel edge, currently at 475.
Its Slope Line indicates that after grappling with the zero line throughout May and part of June, it finally broke upwards, displaying strong bullish momentum.
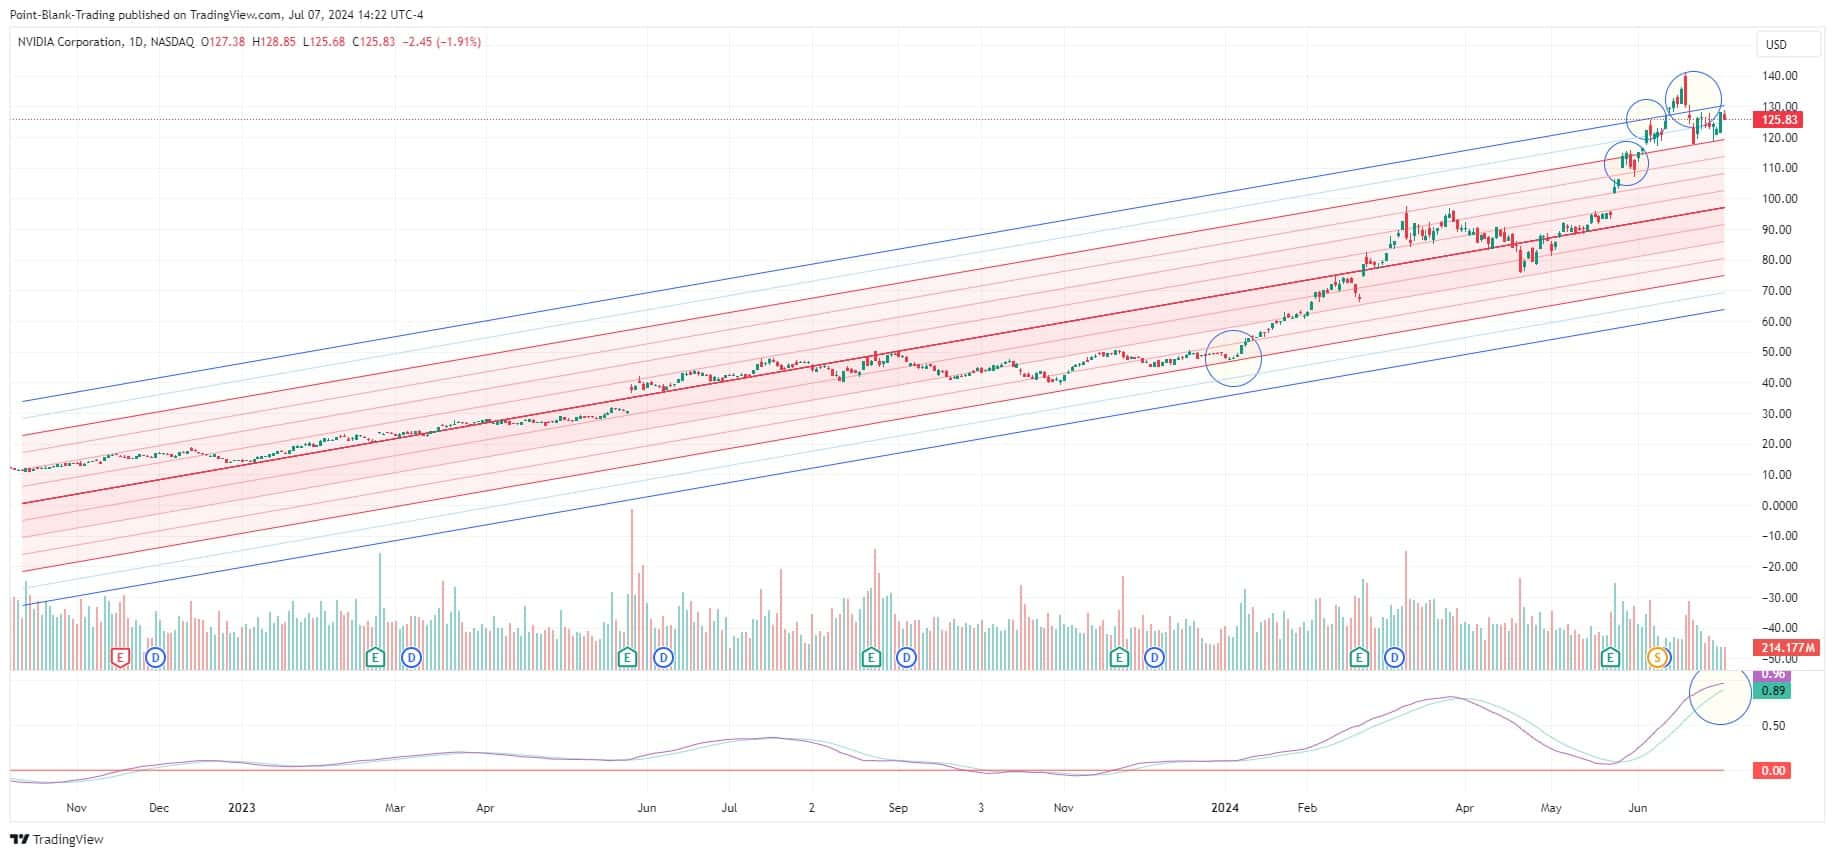
NVDA
NVDA broke out of the Comfort Zone on June 3 and has remained outside it since then, even managing to break out of the channel on June 13 but returning within 4 days later. It has found support at the upper edge of the Comfort Zone, the +2stdev line currently at 119.50. Resistance is at the +3stdev line, currently at 130.50.
Its Slope Line still points upwards, but has started to flatten slightly, indicating an initial loss of upward momentum. NVDA must return to the Comfort Zone, or it will remain overextended and its next correction could be very strong.
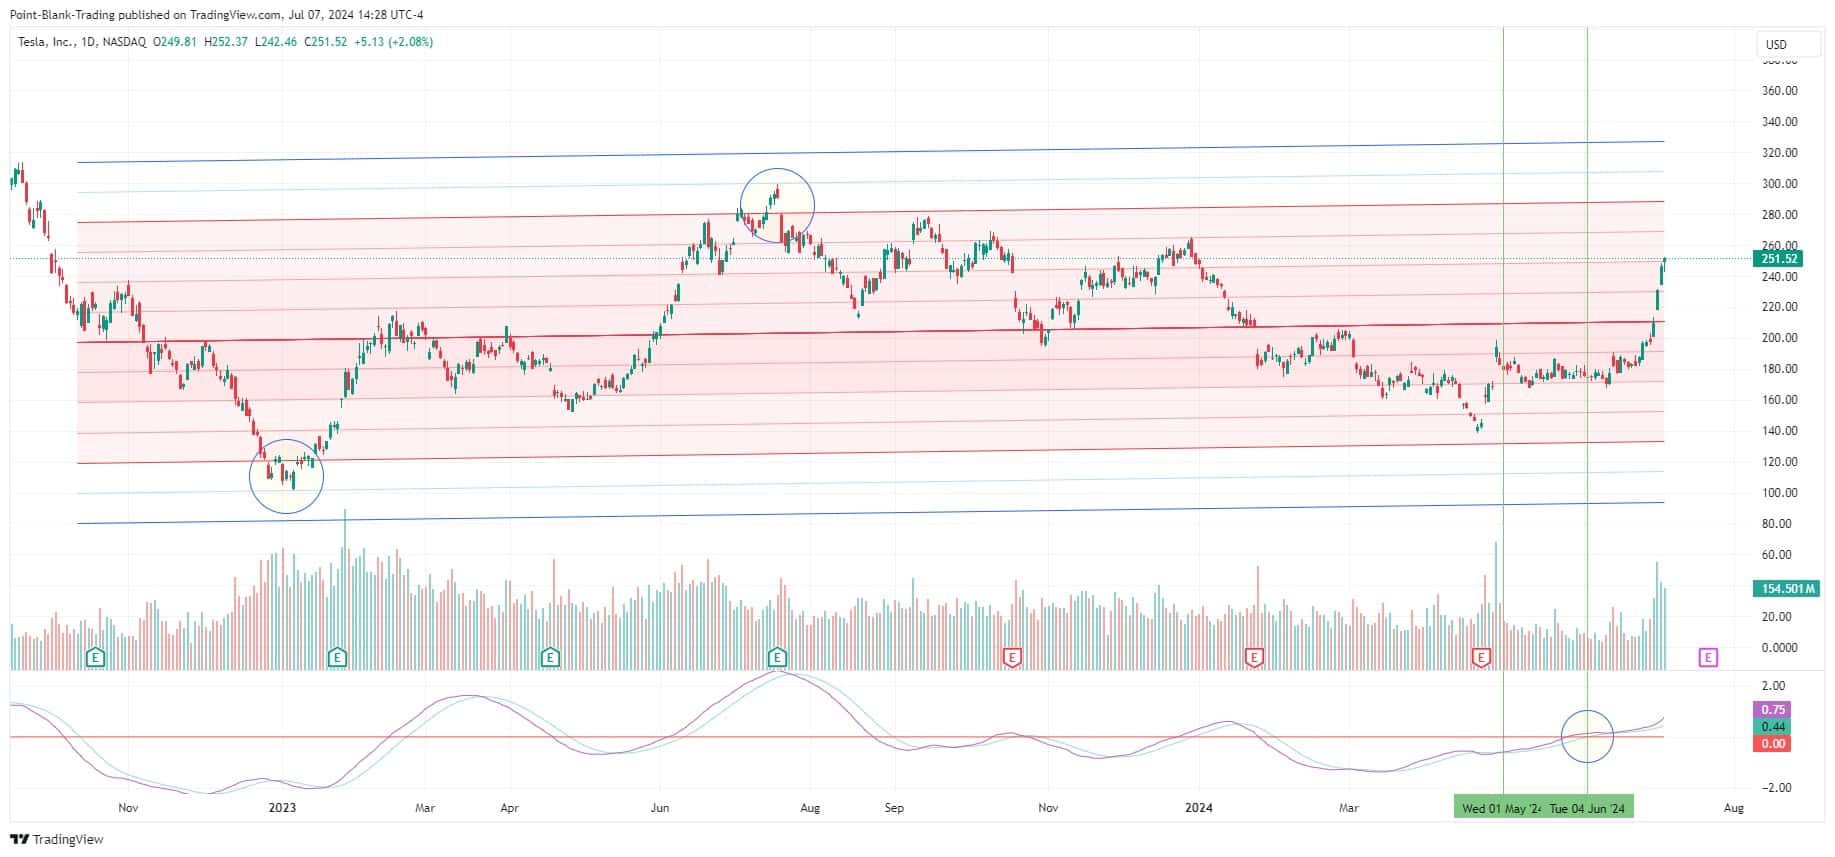
TSLA
Among the Mag7, TSLA is the one trailing behind and striving to catch up with the rest. Its Regression Channel had been sloping downward with a negative gradient. The Slope Line halted its decline and flattened between February and March, initiating a straightening of the channel. It reached the zero line (the 60-day LRC was horizontal) on May 28, crossed it the next day, and has since started tilting upwards.
TSLA, among the Mag7s, has the most room to continue to rise. It closed last Friday right on the +1stdev line. Its next targets are the 1.5 stdev line, currently at 249.50, and the crucial +2stdev line, representing the upper boundary of the Comfort Zone, currently at 289. Over the past two years, TSLA has swung from one extreme to the other; therefore, it is likely to attempt reaching the upper limit of the Comfort Zone this time as well.
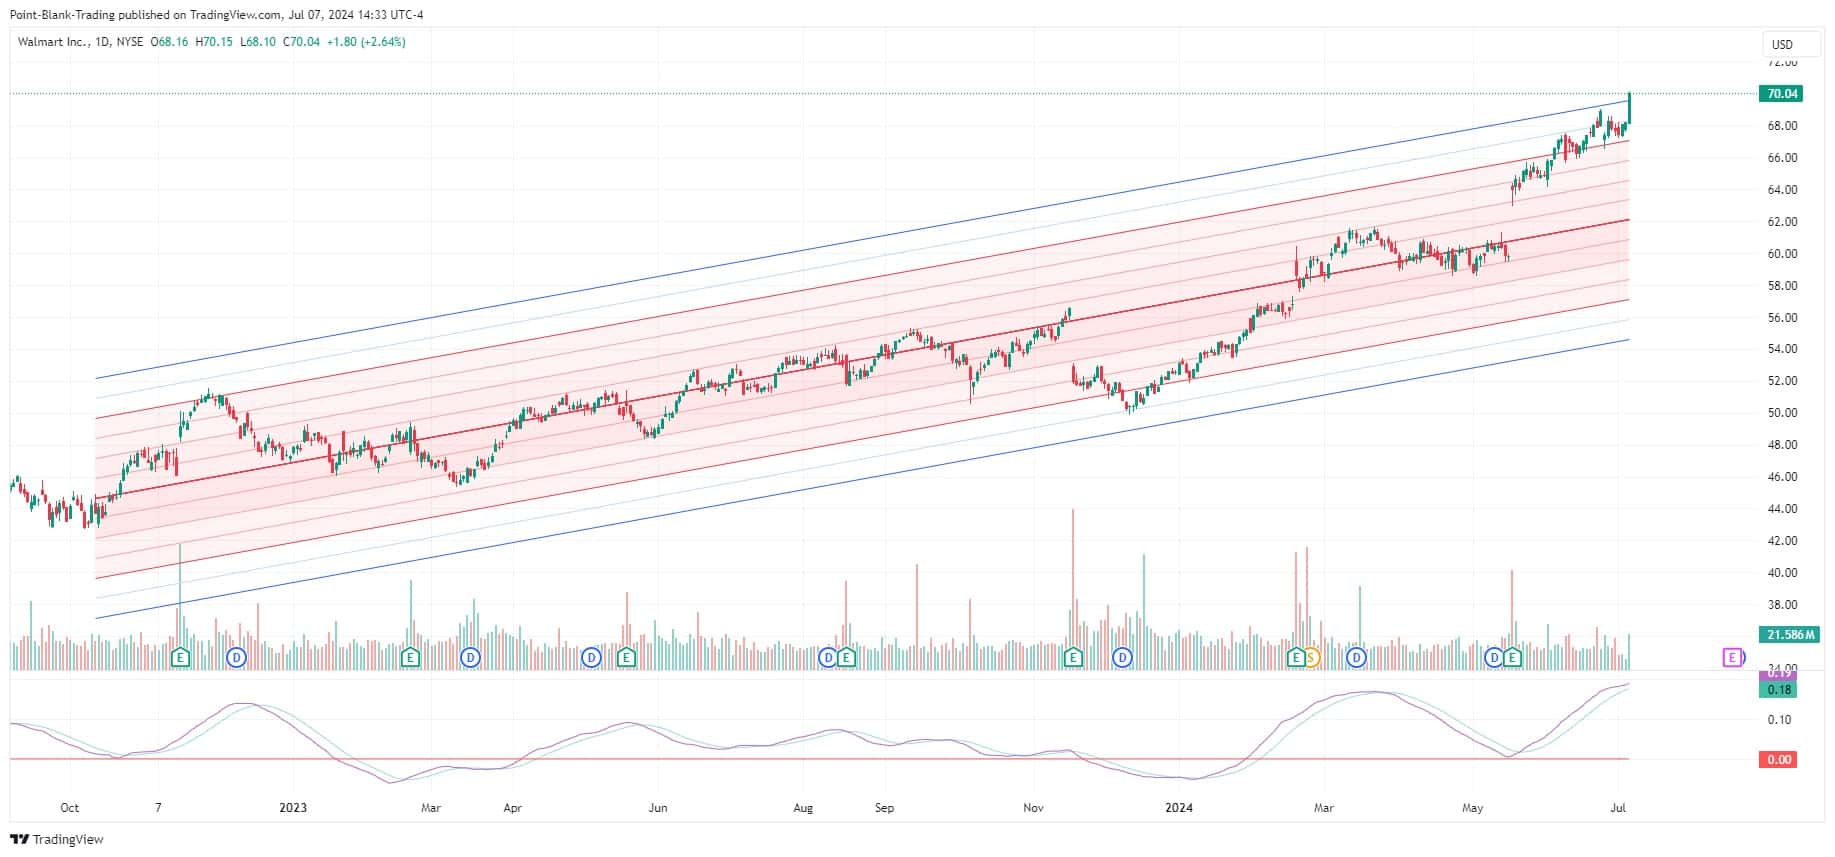
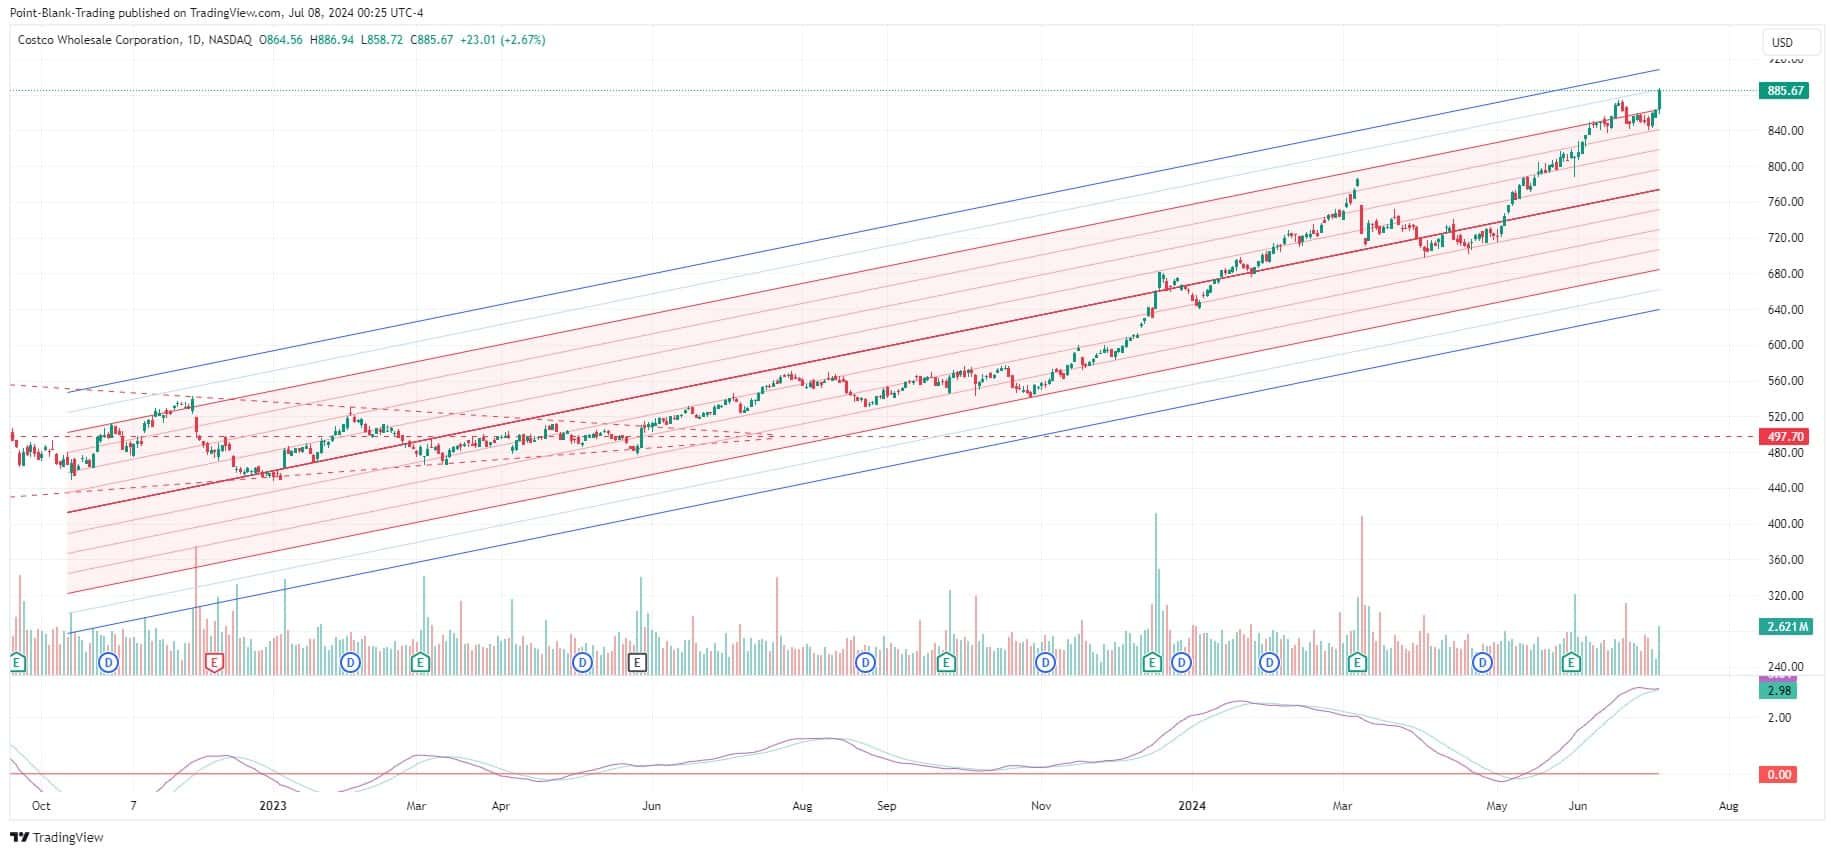
Not all is tech
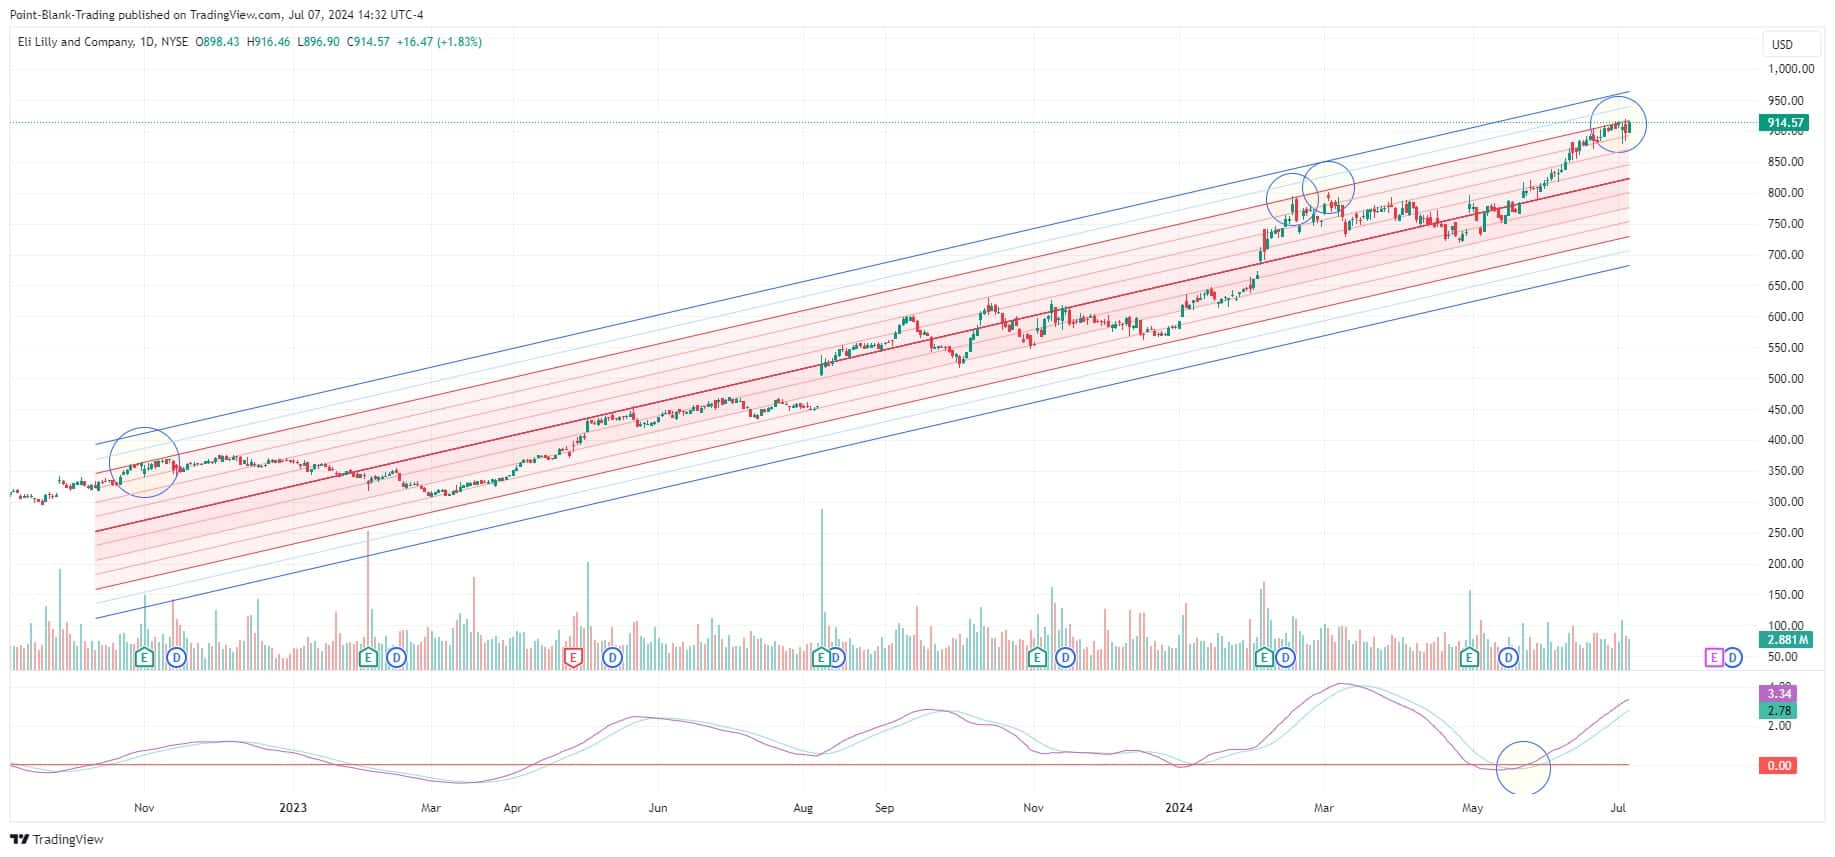
Take a close look at the charts for WMT, COST, or LLY, and then form your own conclusions.
Sectors
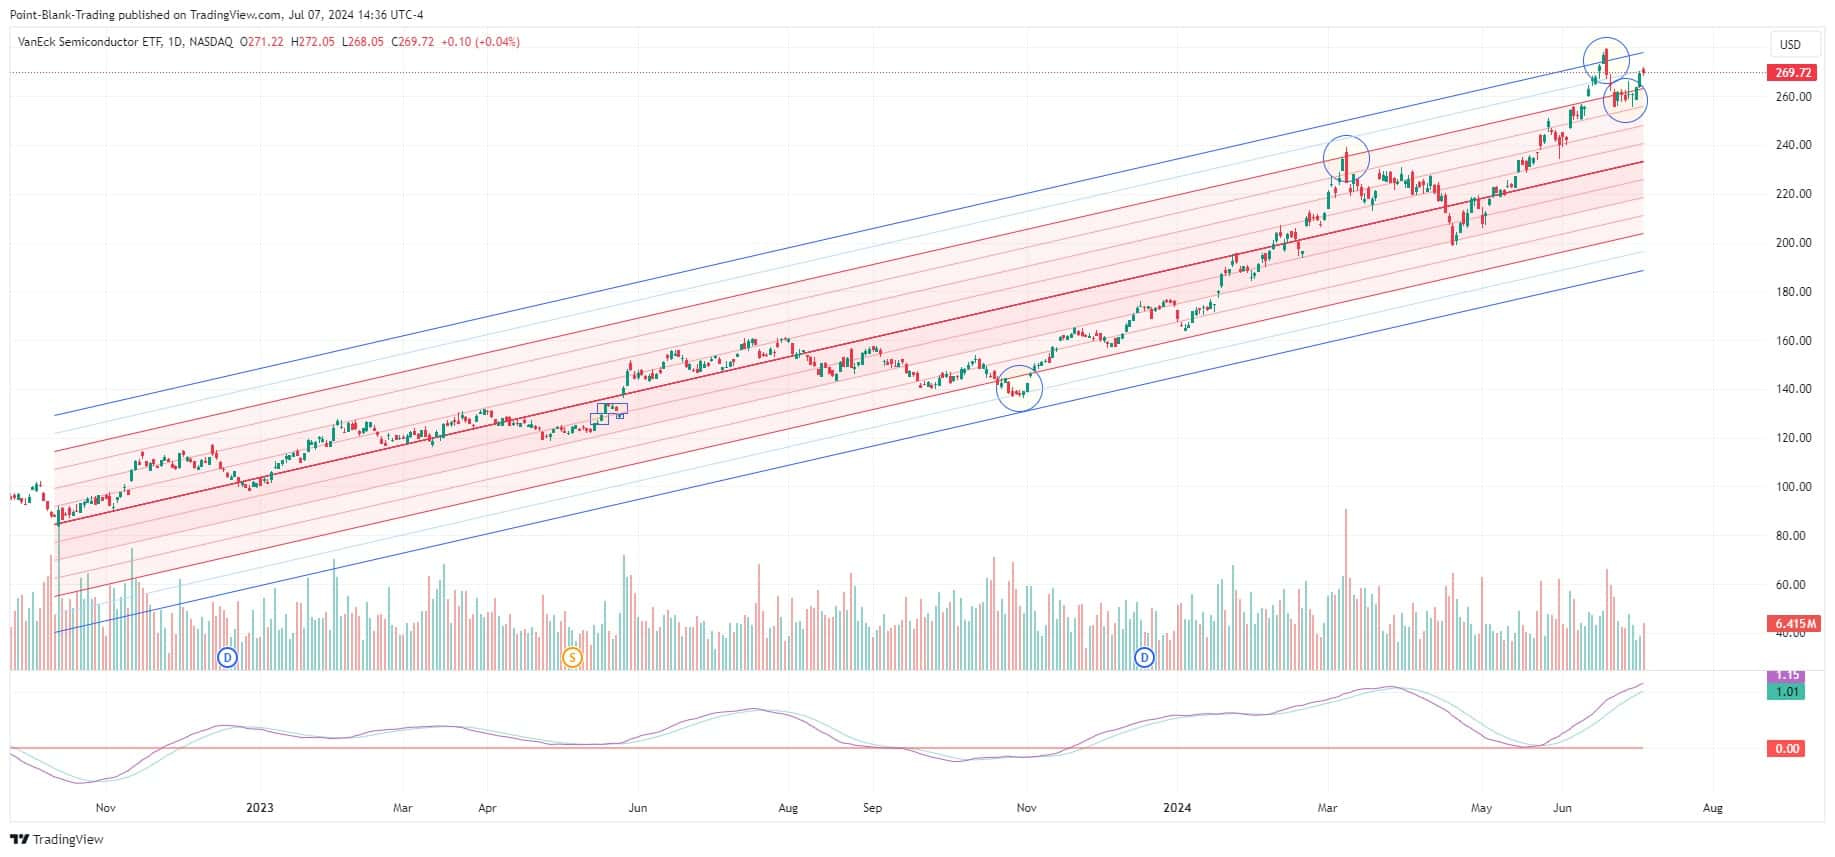
SMH
The current rally leader, the semiconductor sector, broke above the Comfort Zone on June 12, managing in 6 days to also break above the channel, only to be pushed back into the channel and into the Comfort Zone, where it was contained for seven days, finally breaking above the Comfort Zone again. It is overextended but with strong bullish momentum. Its correction will be heavy when that happens.
Its Slope Line maintains a steep upward trajectory. This line hit a new all-time high last Friday, indicating the strongest bullish momentum in the history of this ETF.
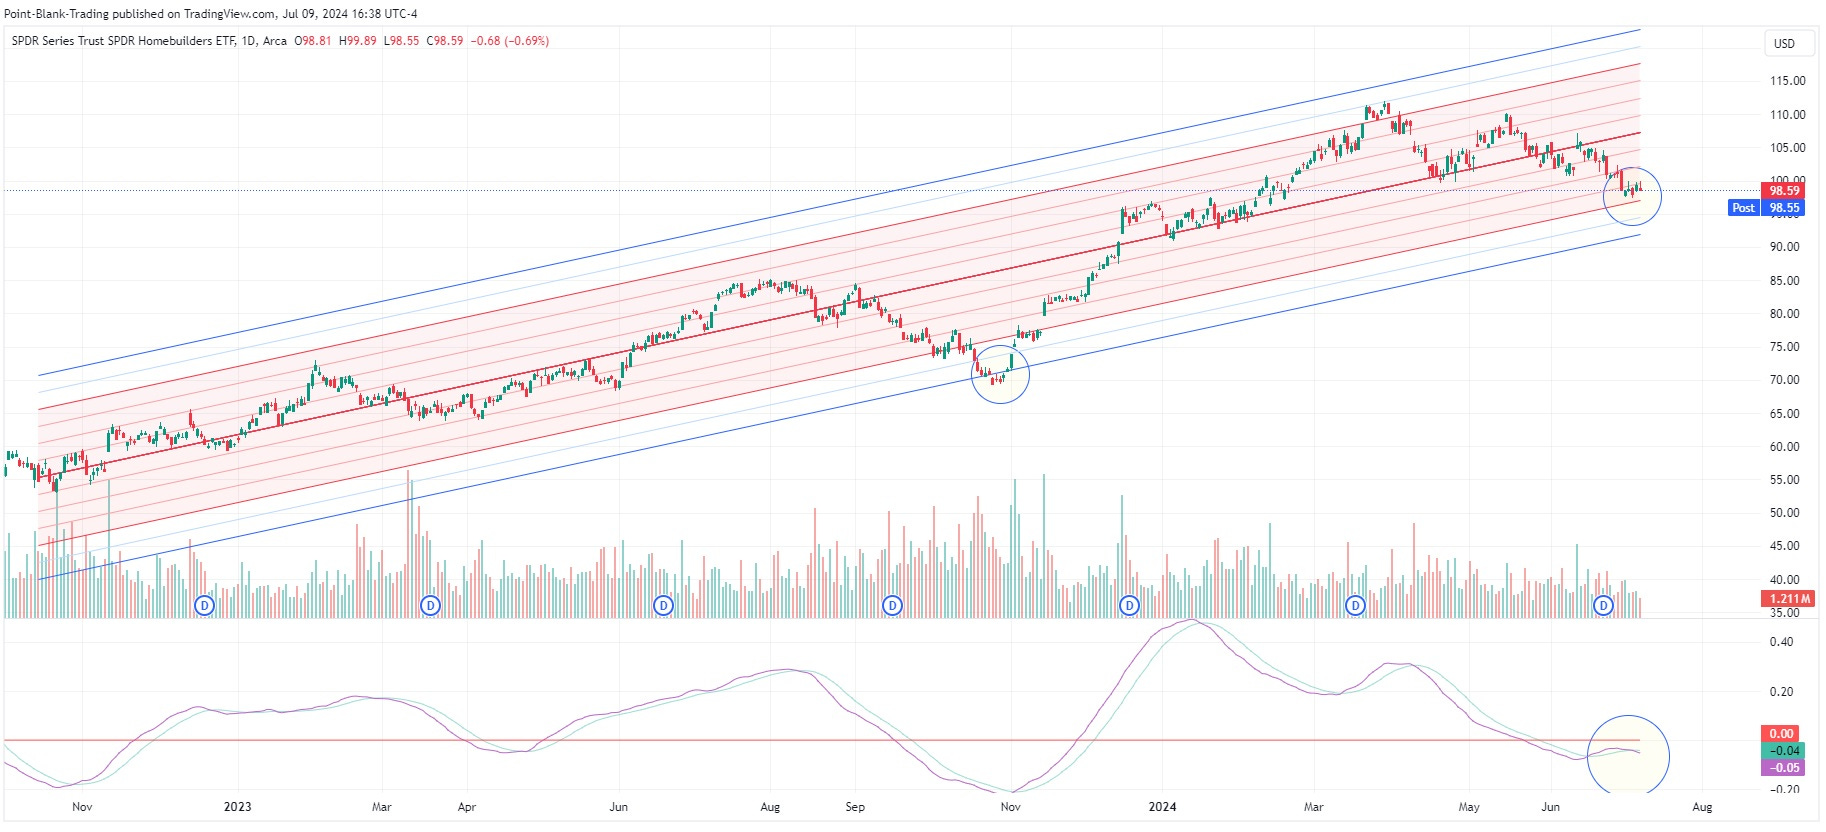
XHB
This sector which was one of the leaders of this rally until last April 1st, date when it started its reversal to the mean after 6 days out of the Comfort Zone, could be ending that process now that it is approaching the -2 stdev line, the lower edge of the Comfort Zone, currently at 97.
Its Slope Line is not yet giving clear signs of trend reversal, but it is giving clear signs of slowing downward momentum. We should not rule out the possibility of it continuing its downtrend to 93, where the lower edge of the channel currently is. We will be watching for a firmer sign of a trend reversal to participate in a bullish move of some duration.
SUMMARY
As expected, the Mag7 that have led a good part of the current market rally show strong upside momentum, but some of them have already reached extreme oversold levels, including indices with high correlation to them such as NDX and SPX, or the semiconductor sector. Although oversold does not necessarily imply SELL, it is cause for attention, as opportunities to return to the mean increase in number and intensity. The more extended the asset is, the greater the "rubber band" effect that will take it back towards the mean or at least towards the Comfort Zone.
As long as the prices continue to rise, stay long, but remember that a sudden pullback of some intensity could occur at any time.
AMZN, TSLA and META are the ones that still have the most upside potential without being overextended.
MSFT has some room left, but not much.
XHB could be close to ending its downtrend and starting a new uptrend.
GOOG appears to be in the weakest position, although this situation can easily be reversed.
COST looks ready for a pullback.
Learn how to use regression channels and profit from them.
We wish you a happy and productive trading week !