

Decisive week, market is beaten, but not broken...yet
Decisive week, market is beaten, but not broken...yet
Market Commentary for the week from 12/12/22 to 12/16/22 • Issue No. 22 • Analysis and Outlook elaborated by @PointBlank_Algo • GEX charts and data by @TradeVolatility

REVIEW
We have ahead of us a week that will cause decisive movements for the market for the rest of the year. CPI on Tuesday, FOMC on Wednesday, last month's retail sales, and last month's industrial productivity and capacity utilization on Thursday, and above all Quadruple expiration on Friday. At the end of the week Gamma will dictate all the actions, but of course the GEX structure will be the one to tell us the directionality of the move.
It is very important to note that the SPX monthly and quaterly options, which carry most of the notional value of these expirations, are traded through Thursday afternoon and therefore the bulk of the hedging and adjustment moves will begin on Wednesday afternoon and conclude on Thursday.
Despite all these events our newsletter this week will be relatively brief as our position has not changed much from last week, except for more caution due to the more bearish scenario seen on the charts and the current Gamma exposure structure.
Last week we had a variety of opposing signals.
We warned about the negative divergence of the DJT and DJI. According to Dow's law normally the DJT leads, as it did at the October lows. We wrote:
“Normally this divergence would indicate that a DJI pullback would be imminent. This does not mean that DJI would go for a new bearish leg, but it does mean that a pullback would be on the menu until these two indices get in sync“
The Russell 2000, which together with the DJT indicated with divergence the October low and then led with DJI the advance, lagged behind with negative divergence.
About VIX we wrote:
“It has been printing red candles for 10 weeks in a row, which is quite a long period. It is to be expected to have even a dead cat bounce at some point in the near future.
We posted on our Twitter account a chart that if the patterns repeat would be indicating a strong rebound in the short term.“
From the classical indicators we pointed out that CCI and ROC were showing negative divergences and that they had successfully signaled the October lows.
Towards the end of the newsletter we made a list of unfavorable factors for the market, among others we pointed out:
” Many people are seeing SPX touching the trend line and VIX oversold and near support, this could invite a wave of sell orders that could cause a pullback.”
“The SPX stocks above 50DMA Index closed above 90% on Wednesday entering overbought territory. On many occasions accessing that zone has marked a pullback in the SPX.“
Despite all these warnings, based on the readings of the breadth indicators, the weighted put/call ratios, other ratios we manage and the price action in the previous week, we maintained our bullish view and concluded:
“We believe that although there is a chance of a pullback this week, the market will continue its upward march for the remainder of the year“
“We expect that the SPX, after battling with the sellers that are supported by the trend line, will manage to solidly conquer the 4074 level and will enter the noise box, where despite turbulence it will manage to approach or touch the next target of 4181.“
“We once again recommend that you trade with caution, the waters are not as safe as they seem.“
Obviously we failed with our expectations of a continuation rally this week. The pullback that was indicated as a possibility resulted in a negative week that ended with an ugly reversal on Friday.
As a consequence the landscape has turned bearish with all indices below 20DMA, with rejections at important levels and areas and with market breadth -according to ADV/DEC issues/volume- very deteriorated.
However, the bulls have not been defeated and have managed to keep important support levels safe.
We will only review this week a few key charts and present our opinion, plus we will try to post on Twitter every day after the close a summary that we will call “Today in the markets”, which will be a collection of charts with brief commentary that will succinctly look at the technical effects of the day's action.
ANALYSIS
CPI
Macro analysis is not our strong suit, but we bring you here this clip taken from Yahoo Finance:
”Economists project headline CPI rose 0.3% last month, a marginal deceleration from the 0.4% increase seen in October, estimates compiled by Bloomberg show. On an annual basis, CPI likely rose 7.3% in November, down from the prior year-over-year reading of 7.7%.
Core CPI, which strips out the volatile food and energy components of the report and is closely tracked by the Fed, is expected to have risen 6.1% over the same month last year, slightly less than the 6.3% seen in October.
While a continued downtrend in inflation is expected thanks to falling energy prices, strategists at Bank of America emphasize the inflation problem for policymakers and the economy remains "under the hood," with a potential decline in core prices perhaps only the result of holiday discounting and a decline in used car prices. Meanwhile, shelter inflation is expected to remain sticky”
It is expected that if the CPI comes out with a more benign number the market will jump to the upside. Watch for the market to fall on favorable news because it would imply a definite shift in sentiment that was already starting to be felt last week.
FOMC
At the time of writing this the Fed Funds Futures gave a 74.7% chance of a 50 bps hike. This would mark the most aggressive tranche of hikes by the Fed, but at the same time it would be expected that the market will, once again, take it positively.
The unknown is what Powell will say at the press conference, this will be what will ultimately set the mood of the market that day and what will move the bias of traders' bets which in the end will draw the important Gamma risk structure for this week's super important expiration.
SPX / SPY / ES
As could be expected the Trend Line sellers came into action and did what was expected: sell short the SPX accelerating the pullback. But it is worth mentioning that SPX closed at support with a weekly red candle on low volume and with the 100DMA acting as support all week.

SPX stocks above 200DMA Index
It has been closing below the 20DMA for 3 days now, but has remained above the Trend Line that has been in place since April 2021 and above the super important 50% level. You can see our March 20 post on Tradingview where we show the interrelationship of this index and the SPX. The english translation is in the comments of the post.
It is worth noting that the 50DMA crossed above the 100DMA and the 200DMA (not shown) just last week, and furthermore the 20, 50, 100 and 200DMA are already pointing upwards indicating a strong uptrend.

SPX stocks above 50DMA Index
Its pullback signal worked as it broke above the 90% level and then fell below 85%. Despite Friday's reversal it did not collapse and managed to close at support. It has been below 20DMA for 4 days now.
Normally the break below 63% has marked bearish trends. This time for us it will be enough to break below 70% to include it as a major crack of the October rally.

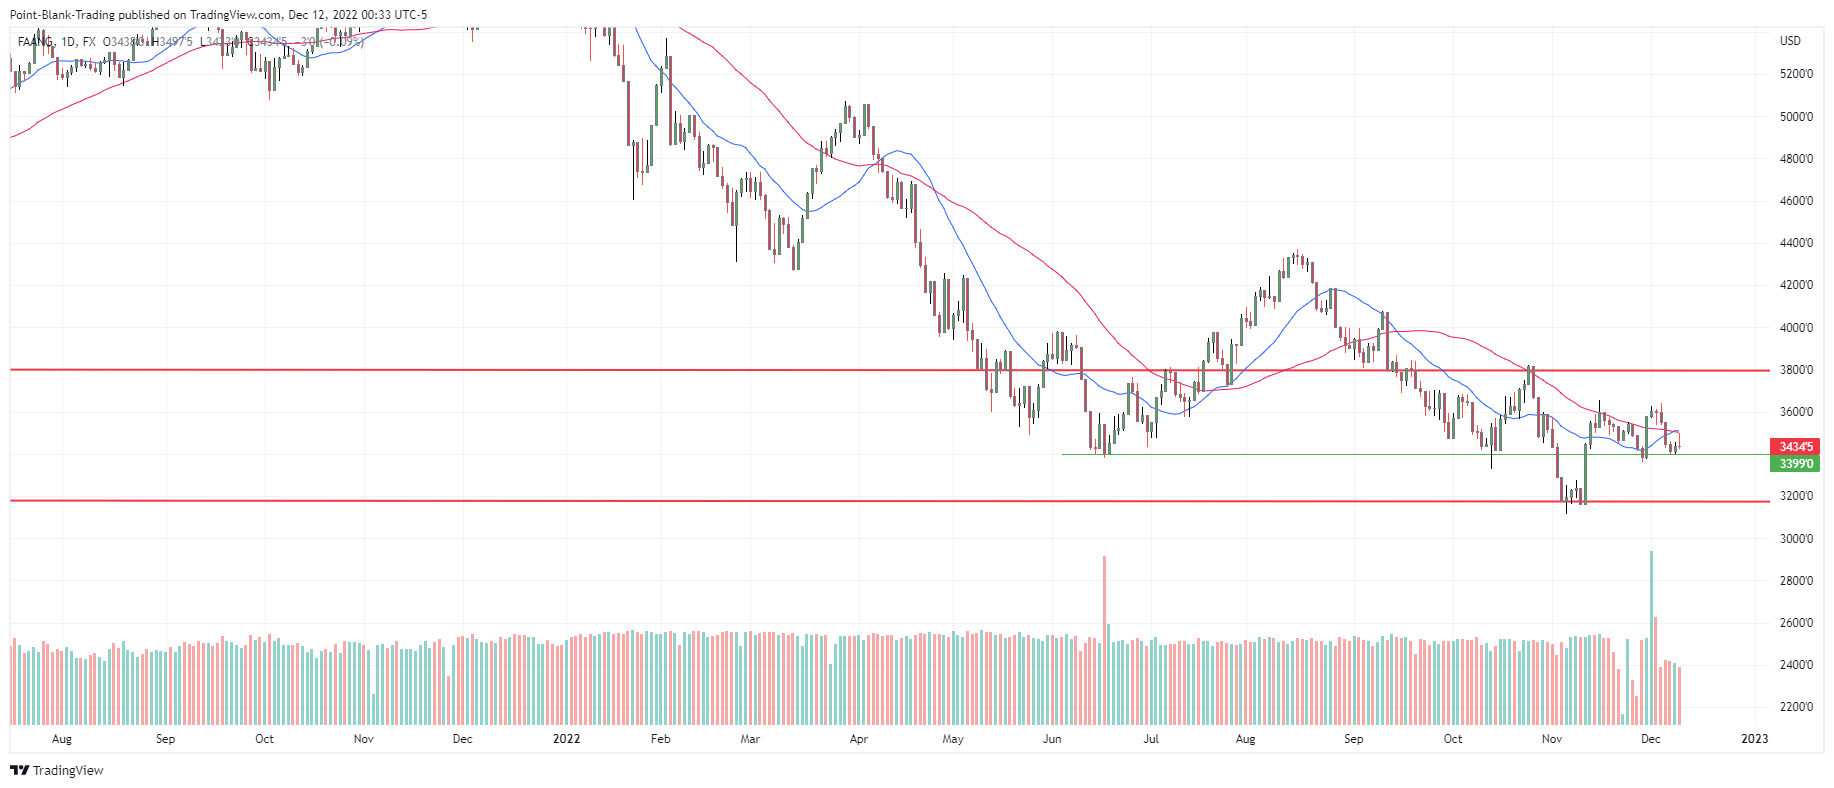
FAANG
This index is again below 20DMA and 50DMA. It has had a hard time keeping up with the market. It closed at support and despite Friday's reversal it fell on less volume than the previous day, and although the week was negative it fell on much lower than average volume.
VIX
As we posted on our Twitter account, its long term Regression Channel indicated that it should bounce upon reaching the mean of the channel which was at 19.5. The bounce occurred and now it is something to add to the bearish signals, it managed to break above 20DMA and the Trend Line that was in play since October 12th.
Its historical Regression Channel shows immediate resistance at 24 and then the very important one at 28.
CLASSIC INDICATORS
CCI Has not reached the oversold zone, but is still pointing down.
ROC Crossed below zero, but is now pointing up indicating a positive divergence.
RSI closed below 50, at 49.27. It shows no divergence, pointing down.
MACD generated a sell signal last Tuesday, it is pointing down and it would need several days of upside market to reverse the current signal.
Williams %R is now in oversold territory
Conclusion: It is interesting to see ROC with a positive divergence, but in general the classic indicators present bearish trends.
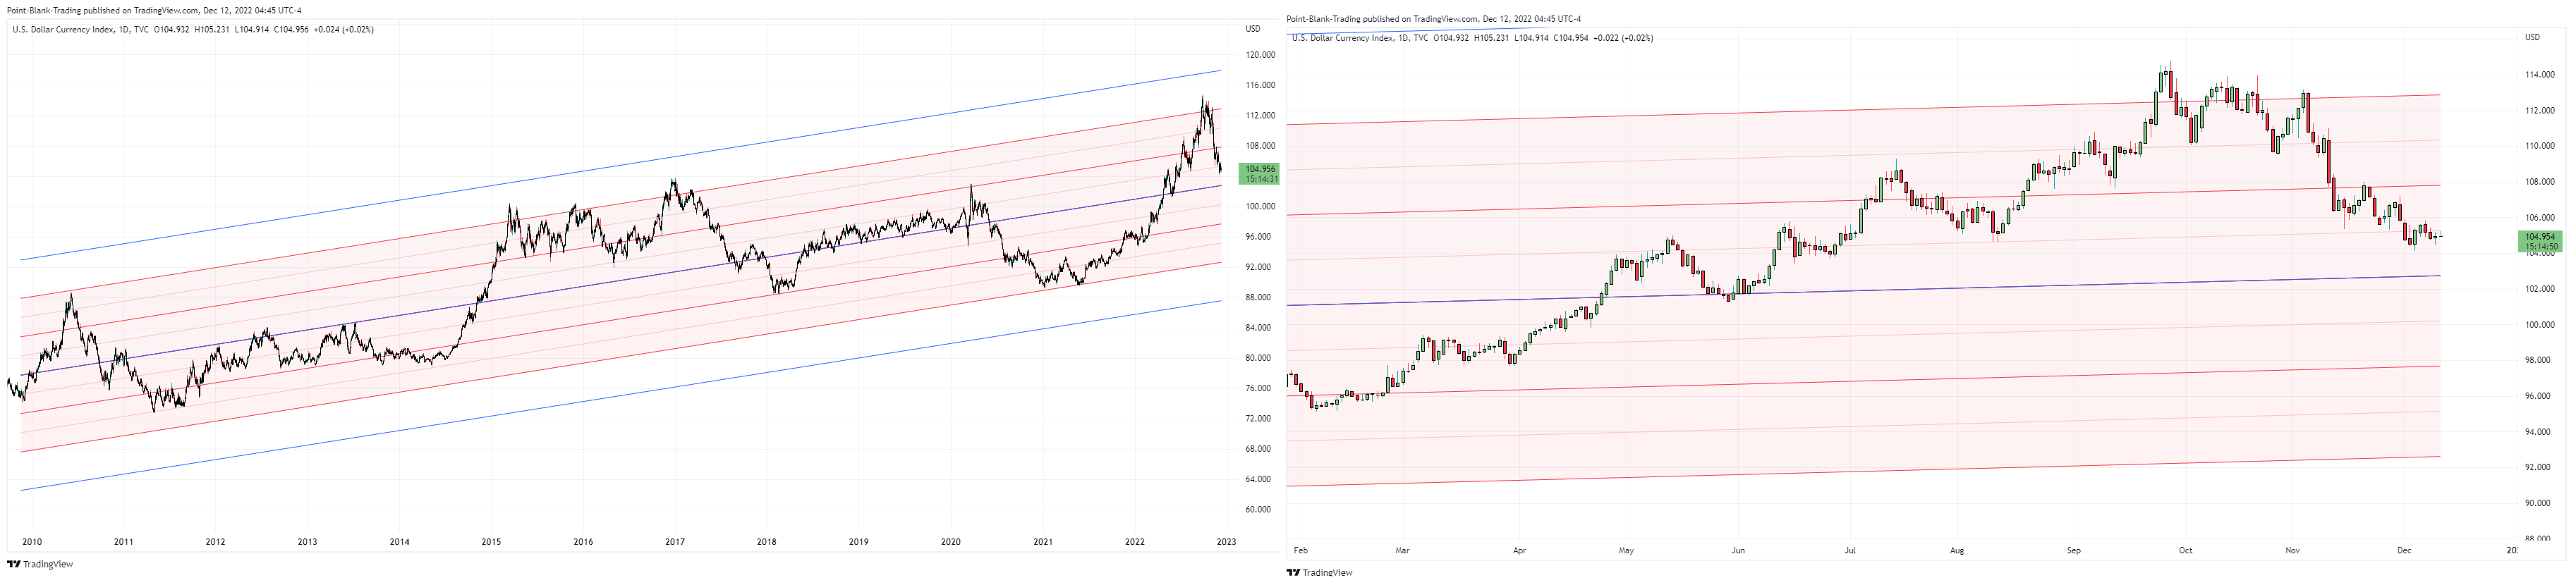
DXY
According to its long term Regression Channel, we believe that it will continue with the downtrend a little bit more until it touches the mean of the channel, which right now is at 102.75
GAMMA Exposure.
Data and Charts from @TradeVolatility
Gamma will play a leading role in the market action this week. It is estimated that more than $2.5 trillion in notional value is at stake for this expiration. There are many, many reasons for Market Makers to exhaust efforts to move the market into the lowest risk zone for them, it is the nature of their business.
The CPI and FOMC announcement could change the current GEX structure, but we have seen in the past that the positions that have been open for some time are reluctant to change. Currently the structure shows us a massive pile of negative Gamma at 3900. A good portion of this accumulation has occurred in the last two weeks. The Open Interest on the other hand shows us that the strike with the most attention from traders is 4000, but there the bets are quite balanced with a slight advantage for puts, so the Gamma risk is not that big, but the accumulation of puts on lower strikes is.

OUTLOOK
There are plenty of bearish forecasts that the end of the world is near and the mother of all crashes is just around the corner. Despite this we still believe that the market will take a bullish path for the remainder of the year. Disappointments in earnings season at the beginning of the year could be the trigger for a new bearish leg.
There are abundant indicators that have had extreme or unusual readings in recent months, readings that have been seen before in major bottoms or before strong bullish moves so we continue to believe that this rally has gas left to burn.
Some of the favorable things we saw were: 1) the fact that despite last week's market pessimism, the market did not go down on high volume but on the contrary on lighter volumes than the previous week and in some cases on below average volume; 2) that all the indices are still within our construction of their bullish trading channels, and 3) that most are at or near important and tested support.
But no one has the crystal ball, so we would change our mind if we see some of the following:
•SPX closing decisively below 3900.
•DJI closing below 33000
•IWM closing below 175
•VVIX closing above 90
•DXY closing above 106
•SPX stocks above 200DMA Index closing below 50%.
•SPX stocks above 50DMA Index closing below 70%.
The conjunction of all these factors, or 2 or 3 of them would be the declaration of a new bearish leg that would most likely take us to the October lows.
That's all for now, we expect a quiet small range day on Monday pending the action that will begin on Tuesday and continue non-stop through Friday.
Trade cautiously, take profits, cut losers quickly, wait for the market to tell you what to do, anticipation is sometimes a bad advisor.
Have a nice and productive week.
Excelente señor Enio, muchas gracias por hacer esto y dedicar de su tiempo!