

Powell and earnings, bull trap or bull market?
Powell and earnings, bull trap or bull market?
Market Commentary for the week from 01/29/23 to 02/06/23 • Issue No. 24 • Analysis and Outlook elaborated by @PointBlank_Algo • GEX charts and data by @TradeVolatility

REVIEW
This past week was an extraordinary week for the market. The bulls are celebrating. What is in store for us this week, a continuation of the rallies or a reversal?
This week the perma bears were squirming and casting spells against the market. Now they are talking about a bull trap. True, the macro environment is not positive at all, but please don't fight the tape.
Bulls, Bears? We are neither, we always try to identify the dominant trend within the time frame in which we are going to make our trades, whether intraday or long term. We were bearish since October 2021 when we saw excesses of the indices within their regression channels; we were bulls in the June lows and their retest in October. The market speaks, don't cover your ears and listen. It is definitely not a good idea to be stubborn when you are wrong and remain in a perma bull attitude when the market is down or perma bear when it is up.
This week we have Powell and the earnings reporting season in full swing. Among others, GOOG, AAPL, AMZN and META will be reporting.
We believe that the market is very close to important resistance and that the healthiest thing for the uptrend is for the market to pull back, take a break and then continue its advance. It is not advisable to rush over those levels and go to overbought extremes because they can cause very deep and sharp pullbacks.
Powell is likely to contribute to our pullback thesis. It is already known that the Fed does not want a bullish stock market in the midst of fighting inflation, so we can expect hawkish comments from them, but we believe that after the turmoil the market will catch its breath and continue its march forward.
More worrisome perhaps are the reports from the FAANGs: GOOG, AAPL, AMZN and META and over and above the earnings they report, the market is going to be more attentive to the outlook and perspective of the future. Any hint of recession will shake the market deeper. Let's be prepared to take action in whatever direction the market takes.
ANALYSIS
SPX / SPY / ES
It managed on Monday to comfortably overcome its 200DMA and close slightly above the Bearish Trend Line that has been ruling since January last year. On Wednesday it went down hard (-69 points), but managed to reverse the move recovering to close down only 1 point. This 1-day reversal is a very bullish event that painted a bullish candle which was confirmed with a rally next day leading SPX to close solidly above the mentioned Trend Line. On Friday there was a follow-through rally that was affected at the close by a sell-off. Friday's rally was on lower volume for SPY and ES and on higher volume for SPX.
DIA / DJI/ YM/ DJT
After leading the market up and down for several months it has lagged behind in this latest rally (or is it still leading and telling us something?).
Like the rest of the major indices, it is above its main moving averages. In November it managed to overcome the highs of August, then it made a pullback. In mid-January it managed to break above them again without reaching the Noviembe highs, then pulledback again. Last Friday it managed to break above the August highs again, but was sold at the close indicating rejection in the area.
It has produced 3 lower highs at that level, but at the same time has made higher lows on pullbacks, leaving it now locked in a wedge that it has to resolve.
Volume has been decreasing on the daily charts, but its weekly candle was green with higher volume, resembling a bullish Harami, while the daily looks like a spinning top.
We have some conflicitive signals, we must be very cautious because although the momentum is bullish everything indicates that a pullback will be mandatory this week.
For the DJI rally to be sustainable, it is important that it breaks above the short-term downward channel it is building.

IWM / RUT / RTY
IWM, along with DJI and DJT, pointed the way up and down during 2022. It is currently running ahead and signaling a bullish path. It closed Friday above the November/December highs and did so on increasing volume. It closed very close to the important resistance at 190 so a pullback is on the menu for next week.
The classic indicators CCI and ROC are showing strong negative divergence on the daily charts. On the weekly CCI changes to show strong positive divergence, but ROC remains with negative divergence. Stochastics is in overbought zone and MACD buy signal is still in force.

QQQ / NDX / NQ / IXIC
The most beaten down of the major indices ran hard and is shown to be the best performer in the last two weeks closing above the November/December highs. A solid close above those levels is necessary to avoid a bull trap and to make sure the rally still has legs.
The daily moves higher in QQQ have been on high volume, but NQ, Nasdaq futures saw lower volume on Friday than Thursday.
On weekly charts of the Nasdaq Composite it is appreciable the breakout above a double bottom pattern which if confirmed would be very bullish.
Among the classic indicators CCI and Stochastics are in overbought territory. CCI has a very slight divergence on the daily chart.
On the daily chart, the classic RSI and CCI indicators show strong positive divergence, while ROC shows a slight negative divergence. On the weekly RSI and CCI remain with their strong positive divergences, but the negative divergence of ROC is accentuated.

VIX / VVIX
VIX has maintained the strong downtrend it has been trapped in since January 24, 2022 when it touched 39, it has had its up swings, but since then has only produced lower highs on each rally attempt.
It closed at 18 important support level. A VIX bounce this week, especially on Tuesday, is predictable, but for anything resembling a rally to be spoken of it must close and hold above 22.
VVIX has been like VIX trapped in a strong downtrend since January 2022 when it made a high of 173. The descending channel of VVIX is very well defined, if it manages to break above that channel the bearishness of the SPX would gain strength. As of Friday the top of the channel was at approximately 100. That is a descending line, so that number will be getting lower and lower. VVIX closed Friday at 83.5.
On Friday January 06 VVIX bounced from 72.5 important support level and managed to climb in several days to 87 level which it could not overcome, this will be the first resistance to overcome in a VIX uptrend.

CLASSIC INDICATORS (SPX)
RSI: Shows positive divergence in the weekly chart. Closed at 64, not yet overbought
CCI: It is overbought and shows negative divergence on the daily chart. On the weekly chart it is about to enter overbought territory and shows positive divergence.
Stochastics: It has no divergence on either the daily or weekly charts. It is in overbought territory in both time frames and in the daily chart it is pointing downwards.
MACD: In the daily chart remains in force the first buy signal (crossing of the signal line over MACD) generated on 6/01/23 and the second with the MACD crossing over the zero line.
On the weekly chart the initial buy signal generated on 7/11/22 remains in force, with MACD still crossing above the zero line.
On the monthly chart the MACD line trend is still down, but MACD has flattened this month (not yet concluded). For the crossover of the signal line and MACD to occur it would take perhaps a couple of positive months.
The signal line and the MACD line have been at record distances that invite a convergence of the two.
ROC: It has strong negative divergence on the daily chart. It is somewhat far from what we could consider overbought territory.
BREADTH INDICATORS
The SPX stocks above 20DMA Index touched resistance at 76% on Thursday, Friday's high was 75% before the late afternoon sell off occurred. It is good that this indicator does not run too fast because it easily reaches the overbought zone indicating SPX deep pullbacks. Friday's candlestick resembles a bearish shooting star.
Its upside momentum remains intact as long as it does not close below 50%, a key level.
The SPX stocks above the 50DMA Index remains above its own 200DMA and above 45%, a key level. It was not affected by Friday's selloff. Its bullish momentum is intact
Our favorite indicator of the internal health of the market, the SPX Stocks above 200DMA Index had the most bullish performance by closing at 66.5%, above the November/December highs. This represents a positive divergence with the SPX, however the classic ROC and CCI indicators present a strong negative divergence on both the daily and weekly charts. RSI shows a slight negative divergence. Watch out for this, perhaps the market is getting ahead of itself. Caution is recommended.

Put/Call ratios remain in a buy signal and continue to fall towards the overbought zone.
The Advance/Decline line remains bullish and shows positive divergence, although Friday was a flat day for this indicator.
New Highs/New Lows is much stronger on the Nasdaq. For the SPX it remains in Buy signal, and shows a very slight negative divergence.
The buy signal from our Algorithm generated on 3/1/23 remains in place although momentum has been lost and the Collusion indicator is flat at this time.
FAANG
The FAANG stock index has performed spectacularly after being one of the hardest hit indices of the correction. It surpassed since last Monday the November/December highs and managed to overcome its 200DMA on Friday. It closed the week just a few points (0.6% approx.) away from a very important resistance marked, among other things, mainly by the August highs. A pullback is to be expected and so is the market with FAANG
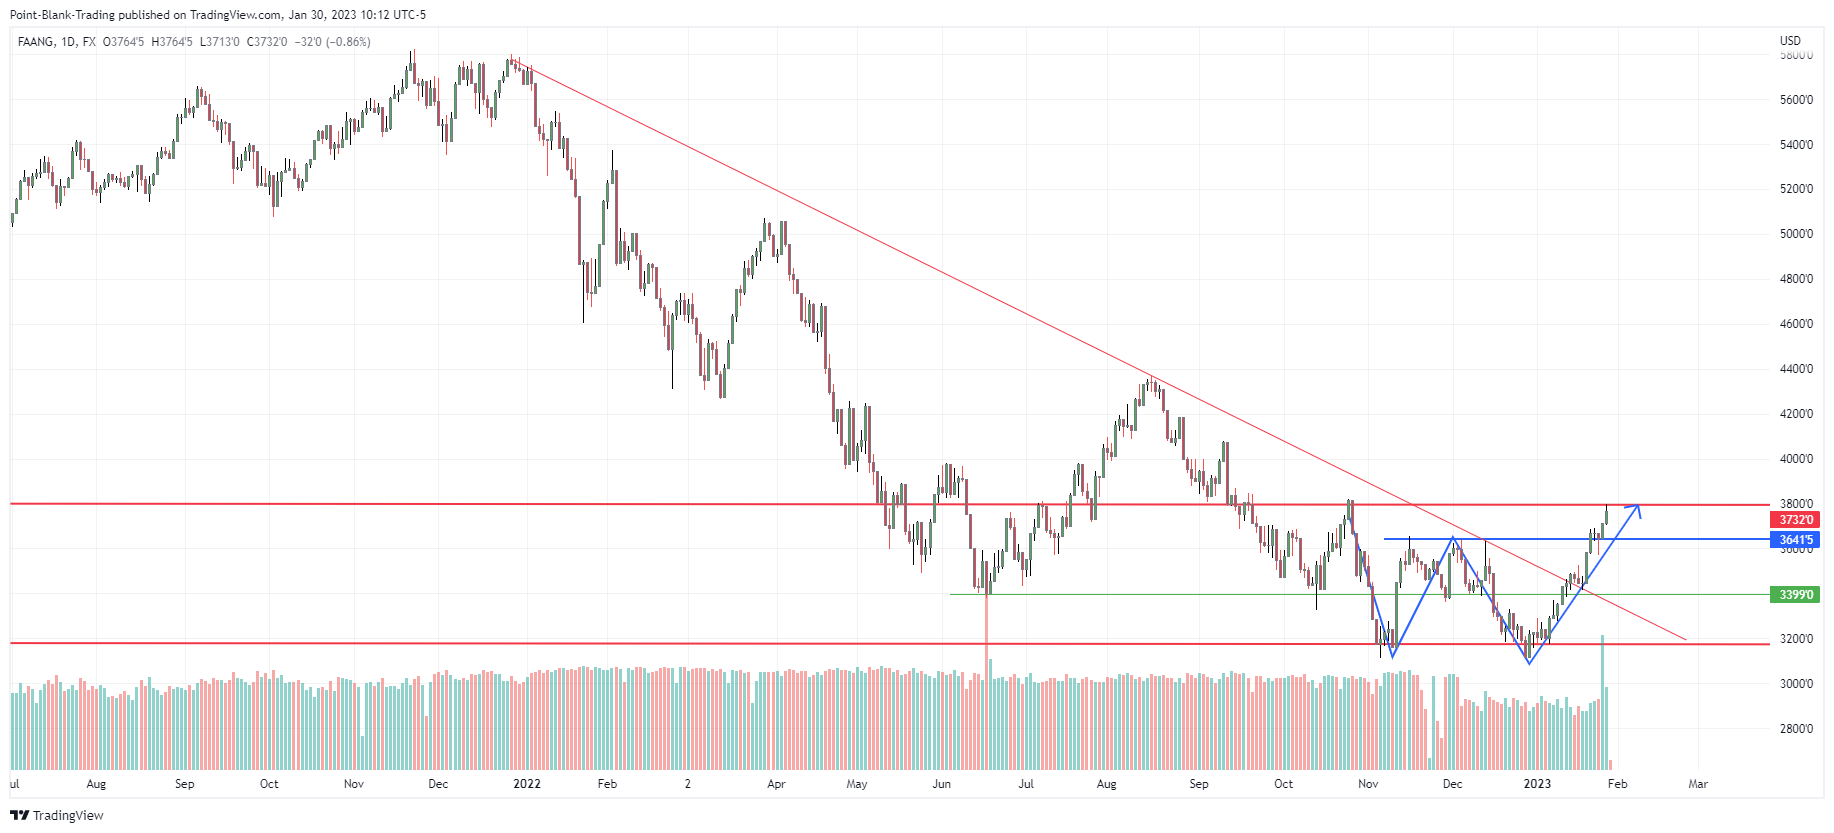
.
Next week AMZN, META, GOOG and AAPL, 4 of its 5 components, present results. The fifth, NFLX, reported the week before last and has risen from there approximately 15%.
The classic indicators show strong positive divergences on both the daily and weekly charts.
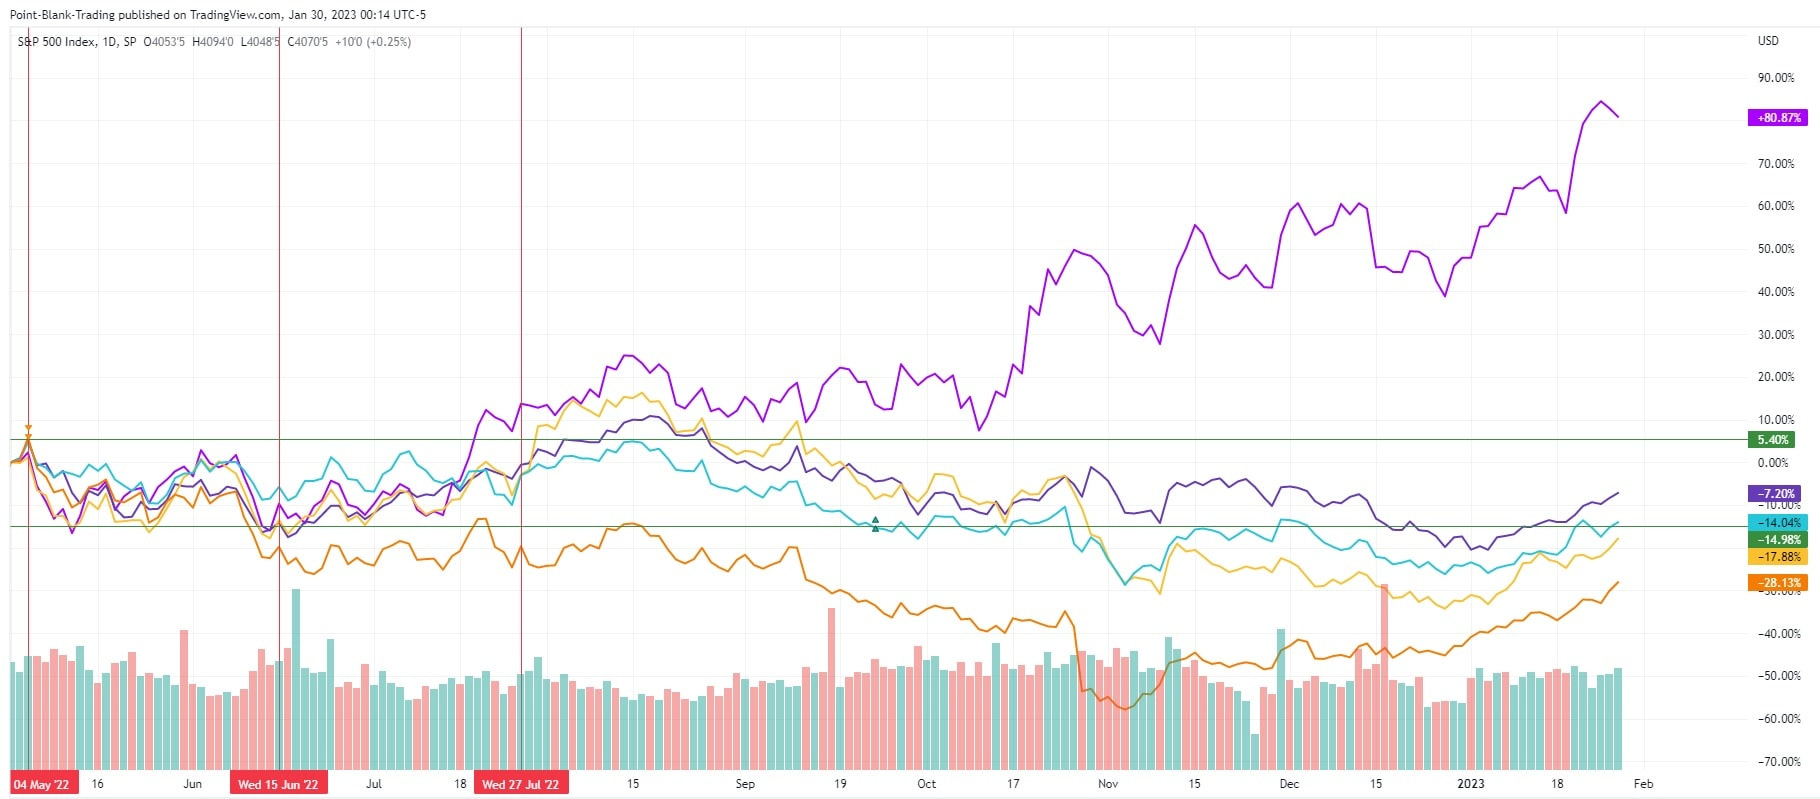
Since July 2022 NFLX stood out as the strongest of these stocks, a position it holds today followed by AAPL, GOOG, AMZN and META, in that order.
This is one of the posts we did on NFLX back in September 2022.


XLF
Attempted unsuccessfully to exceed the December maximum. Reversed
Its rise over the last 5 days has been on falling volume. This fact plus Friday's candlestick and price action lead us to expect a pullback of this index this week that could take it initially to 35 where it rests an important support and the 50DMA.

GAMMA/GEX
Gamma on Monday has a big stack at strike 4100, which could be considered bullish, followed by another at 4050. The price is practically in the middle. That could be Monday's trading range.
For Tuesday the big stack at 4100 remains, but followed this time by a stack at 4075. By Wednesday, Powell's day, the Gamma is scattered mainly from 4050 to 4150 with very similar sized stacks at 4050, 4060, 4075, 4100, 4175 indicating that although most of the bets are bullish there is indecision in the size of the move. For that day we also found 2 negative stacks, slightly smaller in size than those mentioned, located at 4025 and 3980.

DXY
It continues to be trapped in a strong downtrend. It is trying to consolidate at the 102 level. Classic CCI indicator shows positive divergence on the daily chart and ROC a very strong positive divergence on the weekly chart. MACD will take a long time before giving a buy signal on weekly charts. Stochastics is oversold on both the daily and weekly charts.
Dollar weakness is somehow necessary for a continued advance in the stock market. For now the next target indicated by the regression channels is 100.5
OUTLOOK
Technical signals from the major indices are mainly bullish:
•SPX has a solid breakout above the January 2022 downtrend line and above 200DMA.
•Nasdaq composite appears to have made a breakout from a very appreciable double bottom (W) pattern on weekly charts.
•IWM builds a first cycle of higher lows and higher highs
•DJI has long since broken above the downtrend line that had been in place since January 2022 and even made a successful retest of it last December. It is a bit further behind the other indices and we would like to see it cross above the short term trend line.
•DJT presents a similar picture to DJI.
•FAANG stocks index, as calculated by FXCM, broke a bearish trend line, closed above 200DMA and on daily charts shows a breakout above a double bottom pattern. All very bullish events. It closed very close to important resistance, a pullback is expected this week.
Despite all this bullish outlook it is time to be cautious, the market could turn around for any reason from hawkish comments from Powell, an acceleration of the situation in the middle east or an unforeseen event in the Ukraine war.
This week we expect that there will be a pullback and that the markets will take a break. However, we believe that after that it will resume the bullish course probably until March and then we will see...
CONCLUSIONS
•We expect a pullback in the markets this week.
•VIX which is in a support zone could bounce and most likely jump on Tuesday before the FOMC. A break above 20/21.5 would take it to 24
•DXY may try to bounce this week, but we think the downtrend will continue. We do not see it breaking above 103.5
•R/R favors the downside
Levels to watch are:
•If the bulls do their job well SPX should not close below 4000. Support levels below are: SPX 3960 (200DMA) and very important 3940.
•If it continues its advance this week, SPX will have strong resistance at 4170.
Don't fight the tape, don't get stuck in your opinions, flow with the market.
Be cautious this week and may you have many successful trades.