Is the market really going higher?
Market Commentary for the week 17/07/22 to 07/22/22 - Issue No. 8
Market analysis and Outlook elaborated @PointBlank_Algo
GEX charts and Gamma Exposure data supplied by @TradingVolatility.
REVIEW
Last week was a hectic week that was anxiously awaited due to the number of important economic announcements that were on the menu.
The inflation data was the most anticipated, and higher numbers were expected which prompted the vast majority of Fintwit accounts and other analysts to make totally bearish comments and forecasts. The prophets of doom were rubbing their hands together, expecting a sharp fall in the markets.
For those who did not read our last issue, we said:
“…we decided to stay bullish in the short term”
“It is due to all these variables that even maintaining a bullish position, we recommend extreme caution especially for short-term traders and buyers because there could be shocks to the downside”
“…we do think a visit to 3800 or so is entirely possible.”
The CPI came in higher than expected and set a 40-year high, not good news because of its multiple implications. Likewise, the PPI also delivered negative news for the economy. But it was, despite all these ominous announcements, a constructive week because the market, far from sinking to new lows, managed to resist the onslaught of sellers and recover from each negative announcement to close far from the lows. In fact, sellers were scarce after each initial move down.
This could be the most important thing that happened last week, that change of tone, the bears loss of enthusiasm. It now remains to be seen whether this optimism will grow or at least be sustained this week, which does not have such a busy economic calendar except for a wave of real estate reports.
ANALYSIS
Markets do what they want when they want
Last week's price action really told a story. Upon the announcement of the higher CPI to the consensus, the initial reaction was swift: a sharp drop in the first few minutes after the announcement, only to have the buyers overwhelm the not-so-abundant sellers and recover some of the losses.
With the PPI announcements, was a deja vu, the same exact scenario was repeated. Then, on Friday came the retail sales announcement, which, as we already expected, was positive triggering a considerable upward move that ended up leading the indices to reach one of their major achievements of the past week: to soar back above their 20DMA and to do so on high volume.
So despite ending slightly negative, this was a good week for the markets.


On the negative side, the FAANG stocks index failed to overcome its 20DMA. Of its components GOOG had rejection when crossing that level, and FB closed right there, at its 20DMA.
In addition, we do not like the fact that the SPX stocks above 200DMA index (S5TH in Tradingview) failed to break above its 20DMA, which tells us that the internal health of the market is still somewhat weak.
All indices closed at the top of the day, however, some heavyweights had partial reversals from the highs of the day, this is the case of MSFT, AMZN, GOOG, GOOGL, BRK.B, AAPL among others.
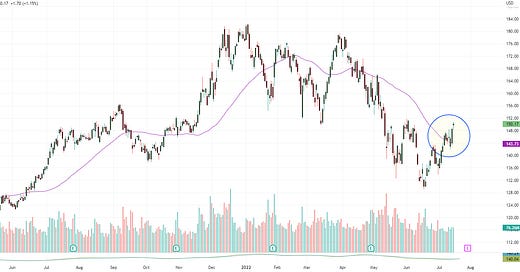
Among the FAANG stocks, AAPL is the one with the most bullish chart. On Thursday it broke solidly above its 50DMA. Since the June 16 lows its volume has shown accumulation. It is now on par with the June high and everything somehow points to it being able to break above it without any problem. This is constructive for the market, because of its specific weight AAPL promises to be again one of the locomotives that will pull the market train uphill.
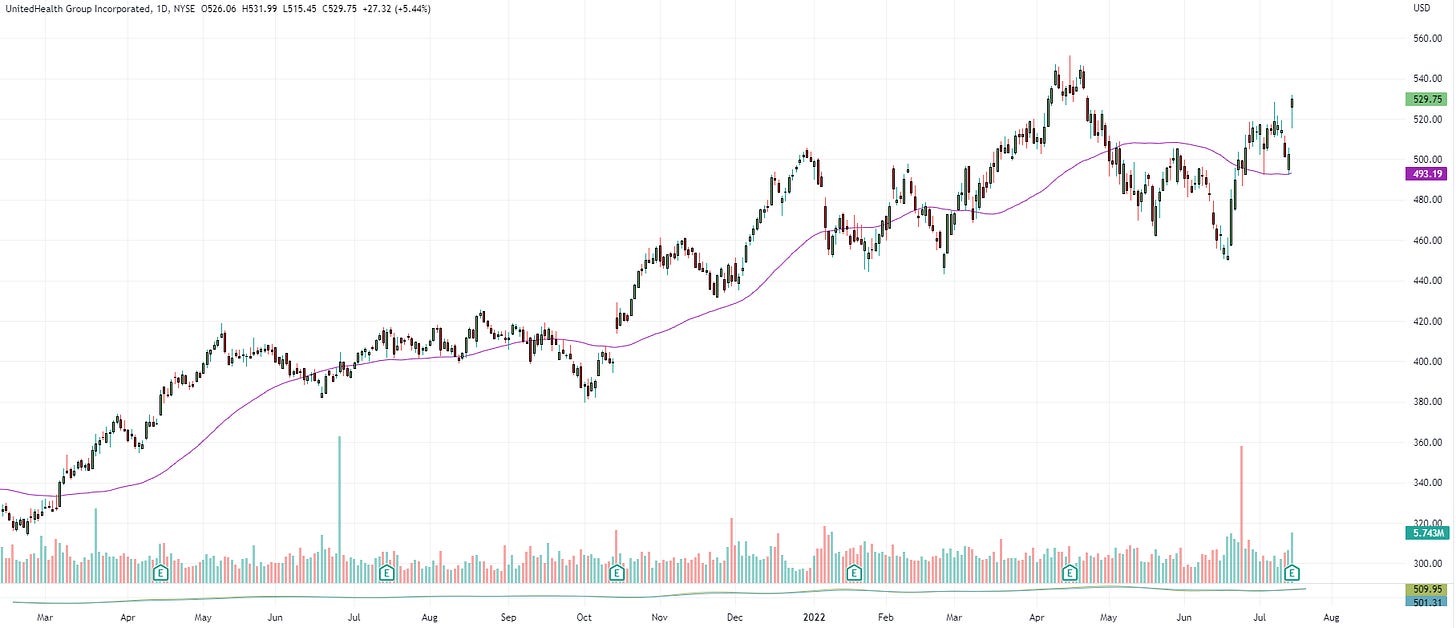
Last week we showed you a table with the top 10 components of the SPX with the major influence in its price. Of these components, we published the chart of UNH mentioning that it was the most bullish chart of the group and that it was due to report earnings last Friday. The result? It rose 5.4% after raising its earnings forecast for the year and after presenting a solid earnings report.
SPX
SPX will have several obstacles to continue its upward advance. The level between 3900 and 3911 will be a first fight, and then, very important, the high of June 28 at 3945 will mark whether the rise continues or not. This level is in confluence with SPX 50DMA currently at 3936 and with the downtrend line that rules since March 29.
Precisely 3945 is also the top of a noise box where SPX has been trapped for the last 24 trading days, a congestion zone from which it has not been able to break out. Pay attention to this, the bullish breakout will be followed by a move that would initially take us to the 4074 gap, and if nothing extraordinary happens, or a black swan appears, it could take us to the June highs that coincide with the upward projection of the box at 4177.
The downward breakout does not guarantee anything until there is a confirmed break of the lows of the year.
Beware of false breakouts, bear markets are full of bull and bear traps.
Classic Indicators
There is not much to comment on. With the fall of the first days of the week those that were overbought went into neutral territory and now they are all pointing upwards, which makes a bullish consensus.
In all the indices (SPX, NDX, DJI, RUT) the classic indicators show a similar picture.
Our Indicators
The Swing Trading algo generated a Buy ES signal last Friday, but it has not done so for SPX which remains in Sell and will need one more day on the upside to generate a Buy signal.
The early entry indicator had moved to Sell and now is back again in Buy signal since July 5th.
VIX
Last week we wrote “Looks like a visit to 23.74 will be inevitable”. We are almost there. VIX closed at 24.23.
The VIX price action could not be more bearish, the trend seems to indicate that it will eventually reach 22, the low edge of a wedge initiated at the beginning of the year.
In the next few days the VIX will hit an Impact Point at 23.74 from where by pure technicality it should have a somehow important bounce which would imply a pullback of the SPX. However, we don’t see SPX going below 3800.
We have pointed out on several occasions that VIX is in an intermediate-term uptrend and a short-term downtrend. It is worth noting that VIX closed very close to its 200DMA and that while that average is not as clean and clear a support as in the case of stocks, it is worth watching VIX's performance at that level, although everything seems to indicate that VIX will continue its downward path until it touches the lower band of a wedge in which it has been coiling since early January, at ±22, from where if could attempt to resume an uptrend.
Last Thursday, even though VIX had fallen 1.49%, our volatility indicator generated an early entry signal to Buy VIX. This indicator measures the relationship between VIX, VVIX and SPX and its signals often anticipate those of other proprietary indicators we use. The current signal appears to have been generated by the price action of VVIX which, in recent days, has resisted its downtrend with more strength than VIX.
We use this indicator in conjunction with others that should confirm each other, to take early small volatility positions or to partially close out long positions we may have in SPX.
This indicator can reverse its signal with another simultaneous VIX and VVIX down day.
GAMMA EXPOSURE
Charts from @TradeVolatility
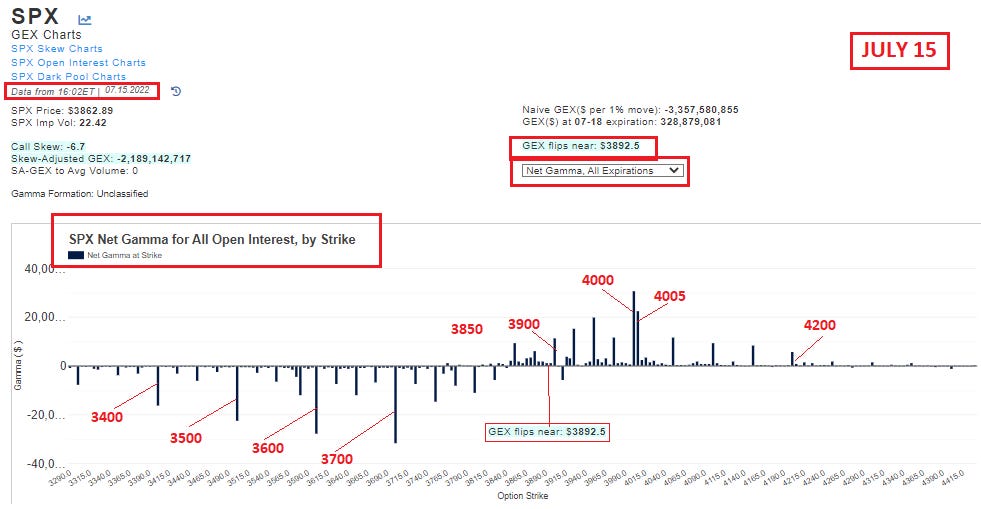
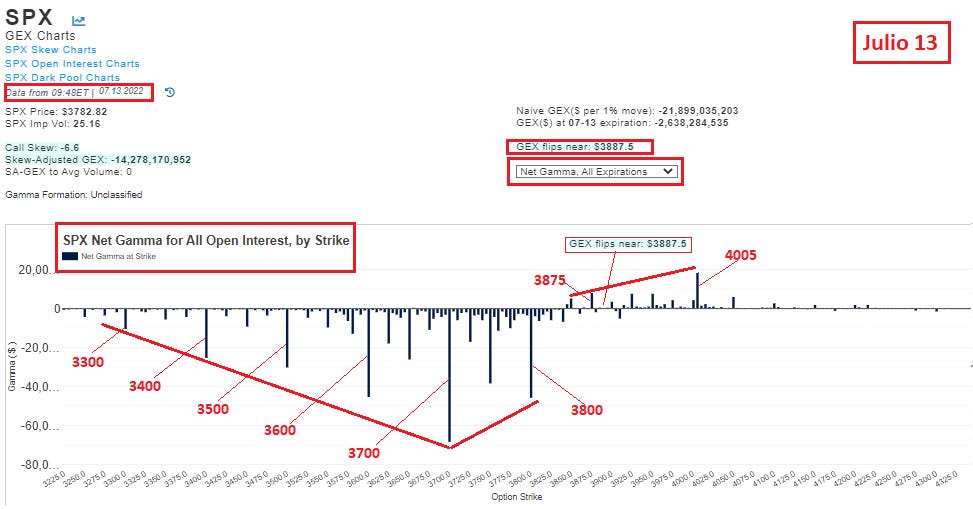
The gamma exposure had dramatic changes last week, perhaps surprising everyone with a change of focus almost overnight from strike 3700 to strike 3850.
The difference in that gamma structure from the previous OPEX GEX is that, apart from the money handled in the June OPEX, almost all of the gamma was negative and the main peak was at 3700 with all other peaks to its left going as high as 3200. This time the main peak was also at 3700, but with almost all the rest of the negative gamma to its right and with some positive gamma peaks.
Also surprising this week was the dollar volume handled by the monthly SPY expiration which far exceeded that handled by the monthly and weekly SPX expiration.
As for the Net Gamma for the entire SPX Options Open Interest it is notable how in two days we already see the initiation of a gamma migration to higher strikes. This migration will persist and totally change the gamma topography if SPX maintains its bullish tone.
EARNINGS
This week perhaps the company everyone will be paying attention to will be TSLA who will present earnings next Wednesday.
Our Swing Trading algorithm generated a Buy signal on TSLA on June 14th. This signal has not been reversed, but it is very fragile now and could be reversed with one more day with a small move to the downside.
TSLA has been rejected from its 50DMA twice in the last six days.
For TSLA to live its old glories it is imperative that it breaks above the $768 barrier, otherwise it could be visiting the $550 level in the not too distant future.
DXY, The dolar Index
We continue to believe, as we have explained in this newsletter, that the DXY, the dollar index, should have a pullback towards the mean of its Regression Channel.
Already in the last few days we have seen price rejection at the +3 stdev line. The only problem with the channel we are using is the amount of periods it covers, because of its short range it is susceptible to "accommodate" quickly to the price, i.e. its bands widen or narrow according to volatility. If the price remains outside the Comfort Zone (the reddish zone between +2/-2 stdev where 95% of price occurrences should happen) for long enough the bands will expand until they engulf the price.
Despite that we continue to expect a correction. In historical backtesting we did of the channel going back to 2000, every time the dollar had those bullish explosions and gone to +3 stdev or beyond, it has had strong corrections.
OUTLOOK
We remain bullish on the market in the short term. Last week's price action indicates this is the right choice regardless of earnings or other economic announcements for the week ahead.
We expect a pullback in the SPX on Monday or Tuesday triggered by a bounce in VIX from important support at 23.74; however, we don’t see SPX closing below 3817.
We are very attentive first to the 3900/3910 levels, and second to the very important zone from 3935 to 3945. We expect a major upward move after 3945 is resolved.
We will also be closely monitoring the VIX action at the 23.74 level.
We expect the DXY to revert to the mean, currently at 104.1, or at least up to the +1 stdev line at 105.55. If the correction is strong enough it will take the DXY down to 101.14. Eventually this dollar pullback could mean fuel for the stock rally.
The market remains sensitive to news, any unforeseen event can radically change the current course. In addition to the economic headlines, there are many international tensions apart from the Ukraine-Russia conflict. China and Taiwan are a good example of this, so it is advisable to practice good risk management and position sizing.
Trade with caution, we are still in a bear market and under a negative gamma regime.


no newsletter this week? I look forward to that every sunday :)
Any chance you can do a twitter spaces and talk through your ideas. Thank you!