

Is the market really healthy?
Is the market really healthy?
Market Commentary for May-12, 2023. Elaborated by the Point-Blank Trading team. Gamma data and charts from @TradeVolatility


This week SPX has been stumbling around in a tight range printing small-bodied candles every day. Not even good inflation or unemployment numbers have been able to pull it out of the morass. Is that bullish or bearish? To what could this apathy be attributed? We believe that the Gamma structure of this week's and next week's expirations has a lot to do with it, coupled with the 0dte options action. As we explained in our Sunday newsletter for all of these expirations there are strong Gamma accumulations at two key levels, 4000 and 4200, with secondary stacks at 4100 and 4150, strikes that were gaining prominence this week and has been important walls that defined the range in which SPX has been performing. It’s still looking like it will be difficult to break above 4200 before next week's OPEX.
On the surface it would appear that the bulls are in control, managing to contain each drop by buying the dip. So far the behavior has been to fall in the morning and rise in the afternoon. When this behavior reverses be alert because it may very well be a change in sentiment. Have the bears tried to knock the market down with all their energy or are they crouching down waiting for the right moment to strike with more force? It is a real possibility considering the distribution pattern that is observed with higher volume on down days than on up days.
Let's see what the internal health of the market tells us.
We continue to see weakness in SPX as our favorite SPX internal health indicator, the SPX stocks above 200DMA index, continues to diverge negatively and has remained below the critical 50% level this week. The other important condition for this indicator is that it remains above its own 200DMA. Yesterday it closed right at that line. It will be very important for SPX to close positive today to prevent this indicator from breaking below that important level. Another factor against it is that it has been unable to break above the most recent trend line being rejected several times.

DJI shows something similar, the DJI stocks above 200DMA index shows negative divergence and yesterday closed below its own 200DMA and below the critical 50% level.
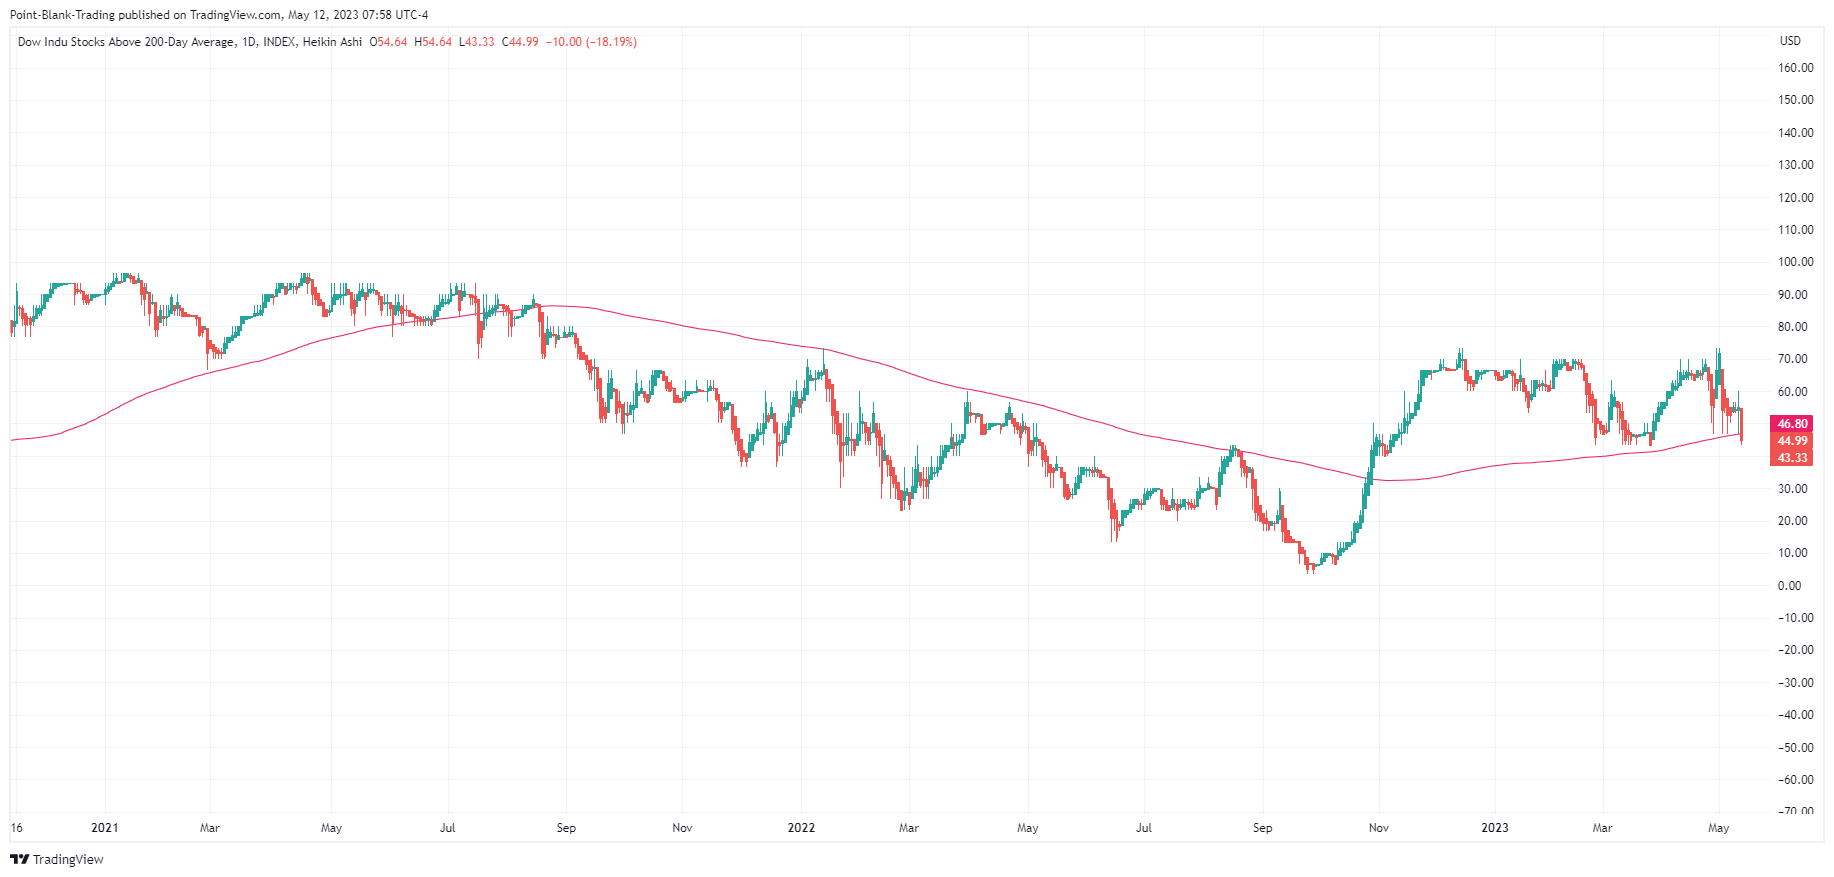
Our Indices internal health scoreboard got much worse last night as both the SPX and DJI ended 100% in red. Nothing has broken yet and Nasdaq which has been the horse pulling the cart is still healthy, but we must be alert to a possible change in market direction.

GAMMA
As mentioned earlier, we believe that the Gamma structure and the action of the 0dte options have been a major factor in the movement of SPX in such small ranges. On this Gamma chart for puts and calls of all expirations you can see that the predominant strikes are 4000/41000/4150/4200 and while 4200 has lost some relevance 4150 has gained it making it an important resistance.

The net skew/adjusted Gamma for all expirations chart shows that 4200 and 4100 are still important walls.

Today's net Gamma chart confirms what was previously said, showing 4100 as important support and 4150 as strong resistance. Let's watch how traders play their cards today to see if they are able to break one of these walls.
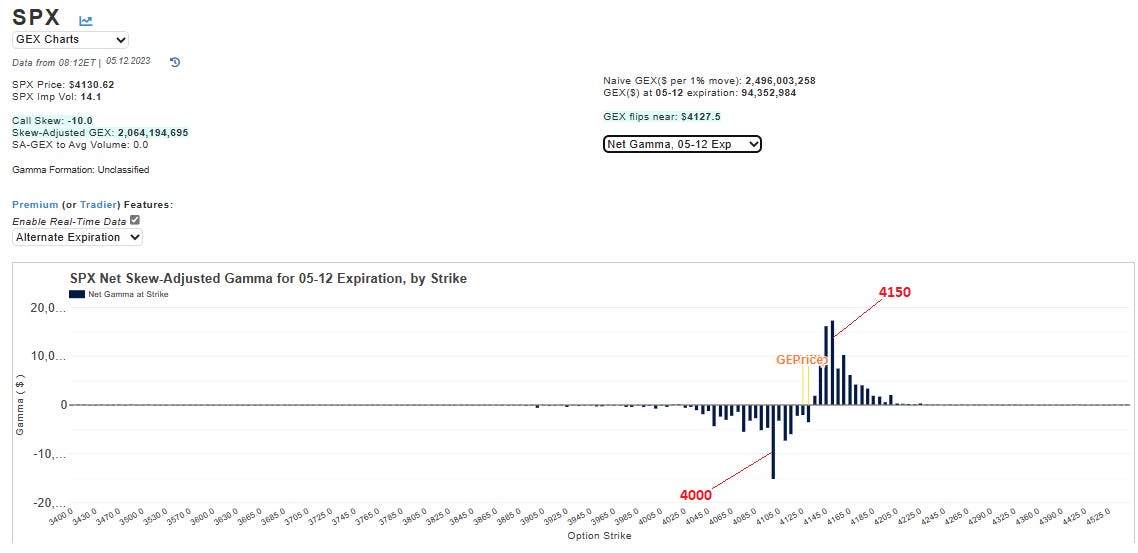
It is worth noting that SPX has been flirting with the Flip point (Zero Gamma point) and has even made forays into negative Gamma land, although it has regularly returned to positive Gamma.
GTH
During the Global Trading Hours (overnight and premarket), action in the SPX options market has remained fairly balanced between puts and calls. Of interest is a trade of 2907 contracts of the 3850/4000 put spread expiring on June 30, 2023.
Among the 0dte options the 4150 call, 4170 call and 4120 put show similar activity, followed by the 4130 put.
In the SPX futures options market there is more put activity than call activity, but within normal ranges. It has been balanced activity with no major bias to either side.
ROAD MAP
Today's map is a 5-minute chart of the SPX cash. The center box levels are:
Bottom= 4120.4
Top= 4131.2
You know what to do, build, clone and stack. Place the Fibs.
The important Gamma levels today are: 4150/4140/4130/4115/4100.

TRADING
The levels between 4140 and 4150 are strong Gamma resistance, but there is a probability that the 0dte will start to concentrate above 4150. If 4140 holds as support there is a probability that the market will move above 4150. If
On the other hand, if this week's pattern repeats today the market will probably pull back in the morning probably towards 4130/4120 and then come back and approach 4150.
We will wait for the opening of the session to see which of these options the market will take, we will be alert and will post a trade if the opportunity presents itself and our indicators confirm it. Remain cautious, remember that Friday expirations are sometimes very volatile.
Have a happy day and a successful trading day.