

Is there more blood coming?
Is there more blood coming?
Market comentary for the week from 07-08-23 to 11-08-23. Gamma charts and data from @TradeVolatility. Elaborated by the Point-Blank Trading team.

Dear subscribers,
First of all we want to apologize for two months without publishing our beloved newsletter. We have had our hands full.
We hope to get back to our rhythm of publishing a Sunday newsletter and a special bulletins when the situation warrants it.
It was undoubtedly a week that caught many by surprise. We can't deny that we were surprised by the furious and relentless sell-off on Friday. It was something we hadn't seen for a while.
A few days ago, before the pullback, DJI was just 1.27% off its ATH, SPX at 4.38% and Nasdaq at 4.63%. This week DJI, the least beaten, lost 1.11%, SPX lost 2.27% and NDX 3.02%.
ANALYSIS
SPX
The idea that August is a bearish month has been published a lot these days, this beginning of the month seems to confirm that, however the SPX problems did not start neither in August nor last Friday, it was rather on Thursday July 27th, just one day after the Federal Reserve raised interest rates for the 11th time. That Thursday the market opened with a gap up, then reversed and closed negative, and although SPX "only fell 0.64%", there was a range expansion that day, SPX really fell 78 points (1.7%) from the high of the day to the close, something that had not happened since March. The result was a huge bearish impulsive candle. The BOJ and the jump in 10-year bond yields above 4% were blamed for this.

On the day of that big reversal SPX stepped on the highest levels of the year, 4607, just 4.38% of its ATH. There it was marked 4600 as the line in the sand.
Then, last Wednesday the market had breakfast with the "timely" downgrade of US Treasury Bonds by Fitch Ratings. A very bearish day with the second range (70 points or 1.54%) and negative volume expansion in a few days.
SPX was slightly positive on Thursday, and on Friday, thanks to the Amazon report and employment numbers, it tried to continue that move, only to end up performing a nasty reversal that started at 12:30pm, and accelerated at 2:00pm when SPX entered negative Gamma territory.
Friday's reversal was the third day of negative volume and range expansion in 7 days, and the second 1-day reversal in 6 trading sessions. While the reversal on Thursday, July 27 and the sell-off on Tuesday, August 2 have their justifications, last Friday's reversal did not, unless you want to blame AAPL's earnings report, we may rather be facing a change in sentiment.
SPX ended up printing a huge weekly bearish engulfing candle on higher volume.
On the SPX monthly chart we see May, June and July were up month, but with declining volume.
SPX closed on Wednesday right at the 20DMA, opened and closed below it on Thursday and Friday. Now the 20DMA, currently at 4525, is resistance. Overcoming and holding above this level will indicate that the correction is likely over.
QQQ Nasadaq100
NDX story this week is quite similar to that of SPX in terms of reversals, distribution pattern and behavior with the 20DMA. The big difference is the double top on the NDX chart that was violated last Friday. NDX was rejected when trying to regain the level above the breakdown line. This offers a more bearish scenario.
DIA DJI
It has held stronger on these dips and managed to close just above the 20DMA, but also shows distribution pattern, reversalss and technical damage on the charts. It printed on Friday a big bearish engulfing candle on heavier volume.
IWM
Despite making a big push, small caps continue to lag the market by being the only major index that has failed to break above the August 2022 highs. After the massive sell-off on Thursday 27-07 it managed to make a big jump and break above those highs, only to be met with a wave of sellers that pushed this index back to the July 23rd lows that have repeatedly served as support. Failure of this level is a great trading opportunity as lower levels would be warranted. Initial target 190.5
For the time being, IWM is at risk of confirming a bearish triple top pattern.
FAANG
FAANG stock broke the daily trendline, very bearish action. We expect a further drop in this index of 1.7%
3 days down on increasing volume
Broke below 20DMA

We said in past newsletters that when some of the horses pulling the cart got sick or weakened, at least an uptrend break would begin, even the start of a bearish leg.
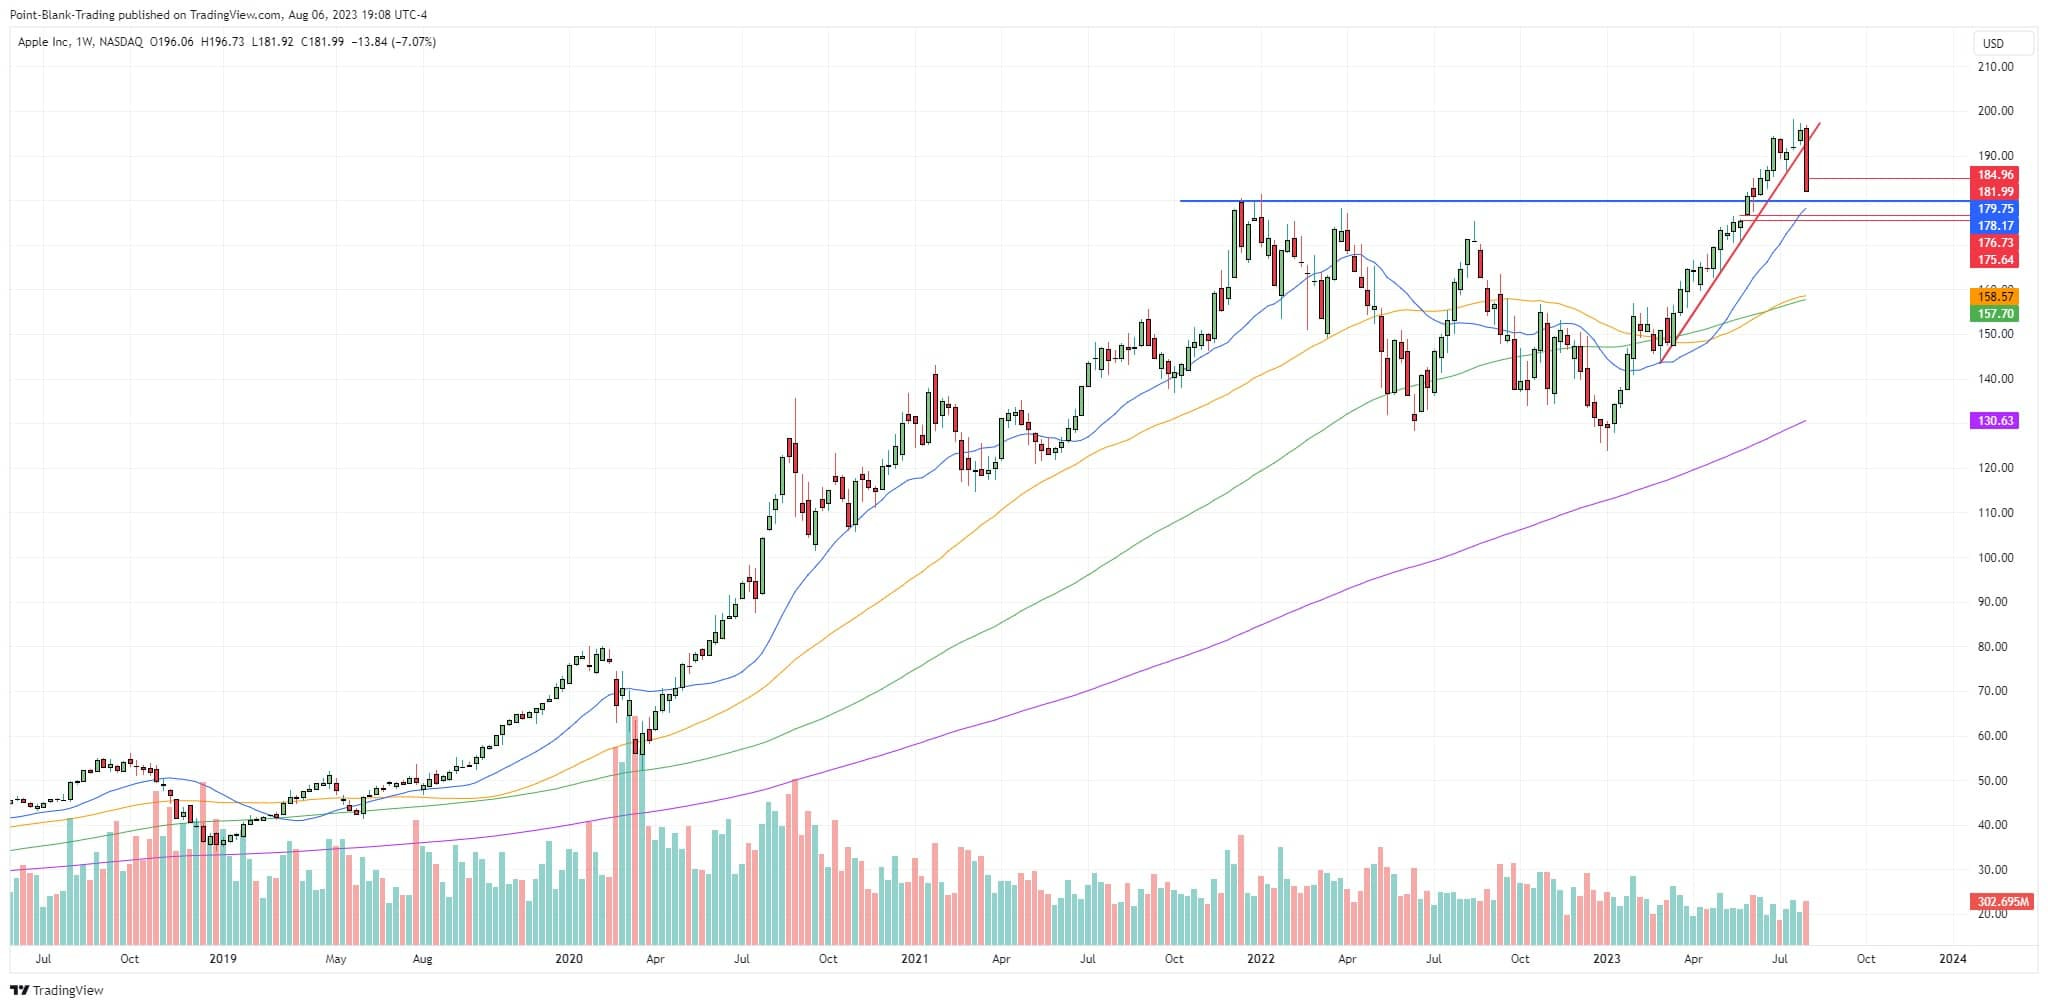
The first horse to fall ill was MSFT, now AAPL has fallen.
MSFT: Printed a nasty monthly Shooting Star in July on higher volume, this bearish pattern has been confirmed with the subsequent downtrend.
It broke below the daily trend line and below the 20DMA about 5 days ago, and below the 50DMA 3 sessions ago.

AAPL: On Thursday before reporting earnings AAPL had closed below 20DMA and below the daily trend line. Friday morning it was rejected from the 50DMA when it tried to bounce, this levels seems to be resistance now. That was very bearish action. With Friday's sharp downside move it printed a weekly bearish impulsive candle of gigantic proportions. Although AAPL has support around 180 counting on it to regain lost ground in the short term is a pipe dream.
Classic Indicators
When SPX, DJI, and NDX reached their highs of the year days ago CCI, ROC, Stochastics and RSI were showing strong divergences with these indices and especially with NDX. Now those divergences have been confirmed.
With the performance of the markets this week these indicators generated sell signals. So far only Stochastics has reached the oversold zone.
VIX - VVIX - VIX1D
VVIX since March 30 managed to respect the support at 82.58 on multiple occasions, bouncing from there with strength on Thursday 27-07, forecasting greater volatility in the following days. as it certainly happened. It is above 20DMA and 200DMA. Despite this strength, it must break decisively above 100 to confirm a new uptrend.
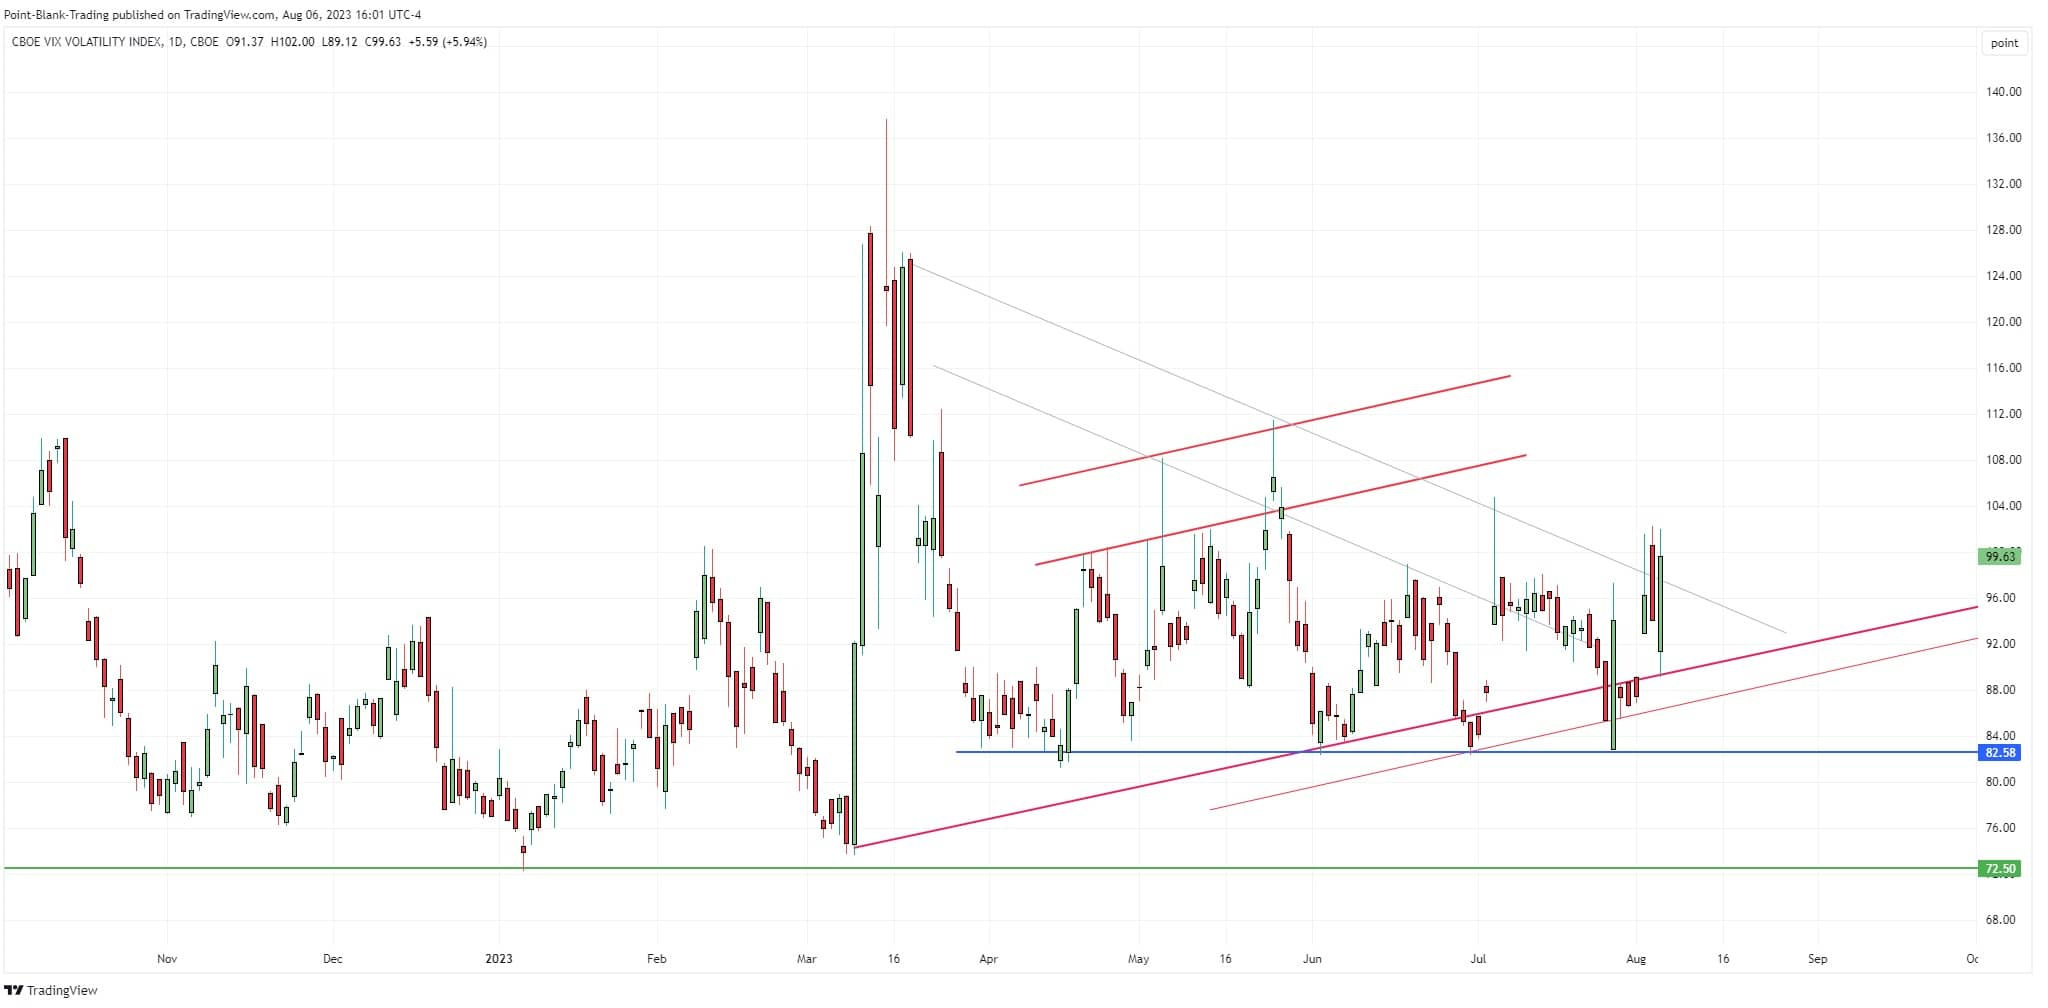
VIX has managed to stay above support around 13 since June 8, but Since March 10 it has been unable to cross decisively above the 100DMA, closing Friday slightly above this level.
It crossed above the 20DMA and the 50DMA since bouncing strongly on Friday when the SPX reversal began. Its 20DMA is curling up, but its 200DMA is still pointing lower.
VIX1D despite the big reversals we have experienced these days this volatility indicator has failed to close above the critical 14.83 level. Until it breaks above 14.83 it will show that there is complacency in the market.

Market Breadth indicators
S5TW, SPX stokcs above 5DMA index, closed at 37.57 below the critical 50%. It closed above trendline support, although more important support is at 26.5 which we believe may be visited later this week.
S5FI, SPX stokcs above 50DMA index, on Monday 24/07 went as high as 89.06, very close to the critical 90% level that determines the overbought area, which after visited is usually followed by major SPX corrections.
It closed at 60.03% very near to the important 59/60 support area from we would expect a decent bounce. Despite the big pullback it remains above the critical 50% level.
S5TH, SPX stokcs above 200DMA index, our preferred indicator of the SPX's internal health, still remains at a healthy level closing at 61.63%, above the critical 50% level. It began its pullback since approaching the 76% resistance level on July 24, 2023. It closed below 20DMA and we expect a bounce from 50DMA currently at 54.60%.
DXY
Despite the strong advance that the dollar has had since its rebound from 100 it was rejected from the trend line, closing below resistance at 102.15. As long as it does not break above the downtrend line DXY will remain in a downtrend.
This may favor the equities' advance.

GAMMA
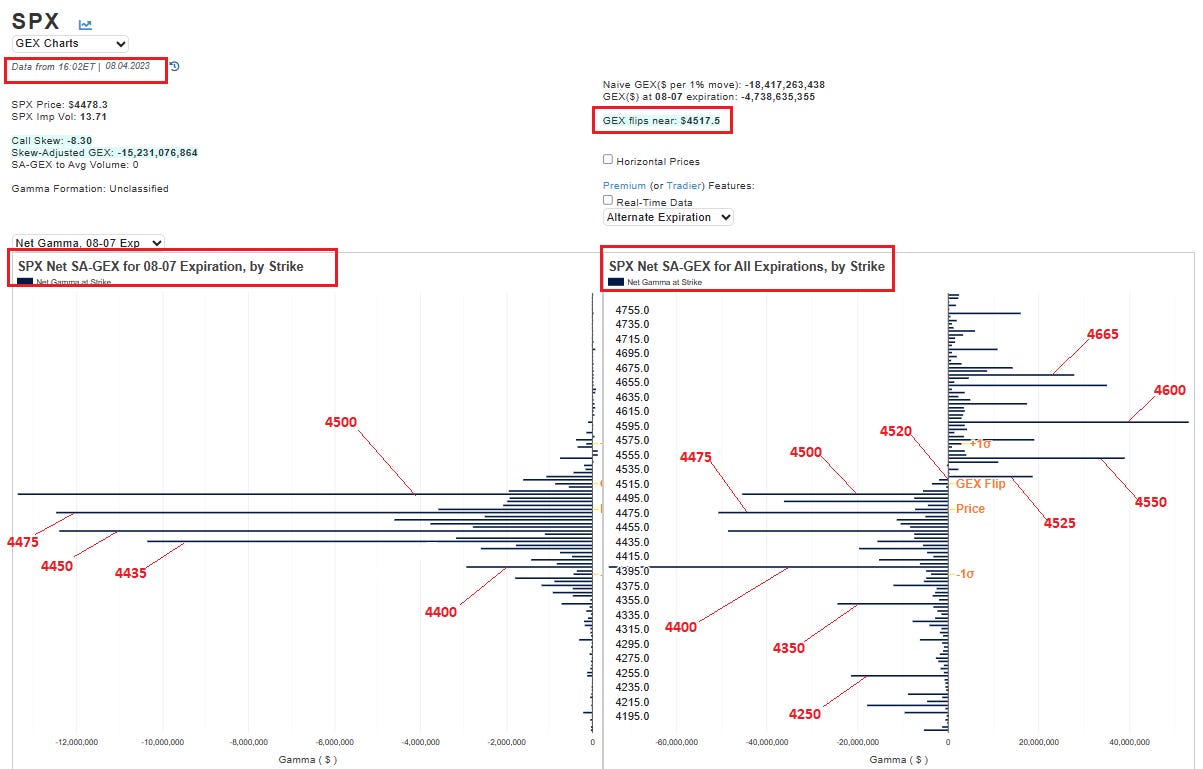
SPX is now in negative Gamma regime, which means that MMs will hedge their positions in the direction of the market, selling if the market goes down and buying if it goes up, which amplifies the move and increases volatility.
The gamma for all expirations is split, but mostly negative, with 4400 as the major negative stack and main current support. 4500 is immediate support.
4520/4528 remains the transition zone, it is a support/resistance zone and the borderline between negative and positive Gamma territory.
The Flip point (Zero Gamma point) is at 4517.5. It is also a support/resistance level as it delimits the Gamma regimes.
On the upside, 4550 is the current main resistance, followed by 4600.
Gamma chart provided by @TradeVolatility
OUTLOOK
The market was undoubtedly very overbought and crying out for a break, or a correction, so this pullback should be welcome. The problem is in defining how much is a pullback, or a retracement and how much is necessary to decree a new bearish leg.
A simple way to elucidate this is to think that as long as lower lows do not occur every move below the last high is a pullback or consolidation. From that point of view it is important to watch the 4385 level. A close below there would be a lower low for the SPX.
Another level to watch would be the 50DMA at 4406 -and rising- whose violation in a decisive manner (a candle opening and closing below this level) would definitely be a very bearish looking action.
Despite the ugliness of recent moves and the loss of about 120 points from the high, SPX has not suffered much damage yet. Its internal breadth indicators S5FI and S5TH remain above the critical 50% level. DIA is still doing better having closed above 20DMA, etc. Does this mean that there will be no further declines? No, it means that the damage done is not lethal and can still be repaired, but beware, the short term momentum right now is down and we expect SPX to go a little lower before stabilizing.
It is the job of the bulls to defend those key levels. Traders have to adapt and trade whatever comes. How do we know in advance whether these levels will be broken or not? There is no 100% accurate way to know, but one thing that can give us a good clue is the confirmation of a change in sentiment, changes of the daily trading pattern could be one way to confirm it. A move from buy-the-dip to sell-the-rally will tell us. Watch for up mornings and sell-offs in the afternoons.
On Monday we will have the chance to confirm this. Considering that several of the sectors leading the rally closed at support levels on Friday, we expect the SPX futures markets to open positive on Sunday and for SPX to open and try to close positive, but if SPX does indeed open positive on Monday and there is sell-off we will consider the change in sentiment confirmed. If on the other hand it closes higher, we should not get our hopes up because in the early stages of a bearish leg the big sellers are deceitful and will let the market bounce and rally and to then unleash an avalanche of sell orders. Beware of bear traps. In this case a drop in volume on up days would be telling us that not all market participants are in on the move.
As for this week's action, we expect the SPX to bounce on Monday, but fail around 4525, coming back down to touch 4460 and even close the 4440 gap and bounce from there. In the short term, we expect 4450 to be important support, which can be pierced, but below which the SPX will be reluctant to close.
VIX in the short term would need to pass or open above 17 to confirm an uptrend attempt, then it would have to break 22 for fear to grow and a bearish leg to be confirmed. Many traders don't pay attention to this, but for there to be a sustainable trend change in VIX it would have to close solidly above its 200DMA currently at 19.40 and the 20DMA at 14.19 should cross above 200DMA. In fact if these MAs maintain their current trend there is no doubt that they will soon cross paths.
We expect S5FI, and therefore the SPX, to bounce from 60 and if that level fails from 52.
We expect S5TH to bounce from its 50DMA at 60 or from the 200DMA at 54.
We expect DXY to hold for a few more days below 102.5 and if it continues its rise 103.6 will be a holding barrier for a while.
We expect SMH, the semis sector, to hold for a few days, its break of support will be followed by further declines for SPX.
If SPX manages to hold above 4550 then it will be in a trading range for a while.
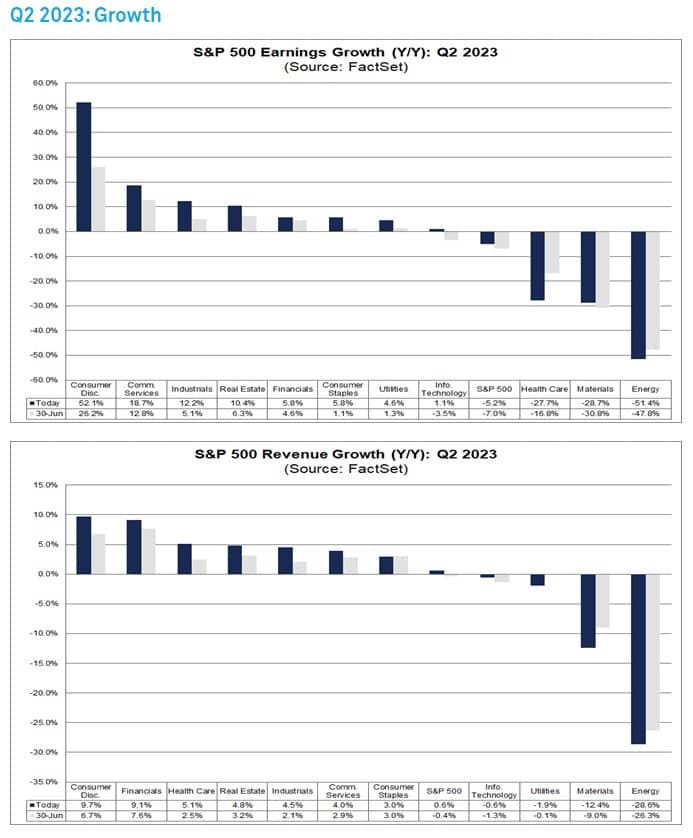
For those looking for a macro reason for this pullback here is a Factset chart with SPX earnings and revenuew growth, despite companies hit reduced earnings expectations there is a clear negative growth trend there.
Do subscribers get weekly newsletter?