

It's the Bear market dead?
It's the Bear market dead?
Market Commentary for the week from 12/05/22 to 12/09/22 • Issue No. 21 • Analysis and Outlook elaborated by @PointBlank_Algo • GEX charts and data by @TradeVolatility

ATTENTION
Substack limits the size of newsletters to prevent them from being returned for exceeding the limits of too many emails. This impedes the publication of as many charts as we would like.
This week we did a special report on whether the Bear market is dead. It will be published separately because of the many charts involved. The link and emails to our subscribers will be sent out today around noon ET.
Thank you.
REVIEW
Last week, amidst pessimism and bearish sentiments floating in the Fintwit atmosphere, we wrote:
“We expect for this week:
•The market to open and close higher on Monday
•SPX to hit our target of 4074
•FAANG index to break above the 50DMA
•QQQ to break above 100DMA
•RUT to break above 200DMA”
Except for the first, all targets were hit even though as the title of the newsletter said the lineup was strong: Powell, PCE, JOLTS, ISM, GDP, non-farm payrolls and so on. Any one of these announcements could have killed the rally, but that was not the case.
The main factor with the power to have reversed the current bullish move was Powell, who on the contrary generated with his comments a strong push to the upside.
Many will say that it was luck on our side, or that perhaps we somehow knew what Powell would say, but that is not the case. We believe that even if Powell had continued his hawkish speech, the market, after an initial failure, would have recovered to continue its upward march.
Friday's non-farm payrolls data was unfavorable and yet the market, after an initial dip, recovered to close above the levels recently conquered.
The mass, meaning the majority of investors and traders, float with the tide, so this week after Wednesday's rally they put on their bullish caps and now the idea is very prevalent in Fintwit that perhaps the Bear market is over and that we are possibly at the beginning of a new Bull market.
Is that true, are we going to see new highs relatively soon, is the downtrend behind us? These and other related questions is what we are going to answer this week. So, read on and let's review the analysis.
ANALYSIS
Antes de ir directo a contestar la pregunta planteada en nuestro titular vamos a chequear primero el estado de los diferentes índices.
DJIA / DIA / YM / DJT
On November 22nd the DJI surpassed its high for the month and 2 days later managed to close above the important August high, becoming the first index to achieve this, but from there it retraced to test the breakout achieved.
The day of Powell's speech took it right there, at the breakout level, from where it launched a strong 737 point rally that led it to simultaneously and solidly confirm the breakout above the August and November highs.
The close above the August highs is important because it is the first time this year that a higher high has occurred. Recall that an uptrend is defined as a succession of higher highs and higher lows. This is the first step in persuading us that the DJI entered a bullish leg.
DJI, YM, DIA and DJT have all a positive week in higher volume.
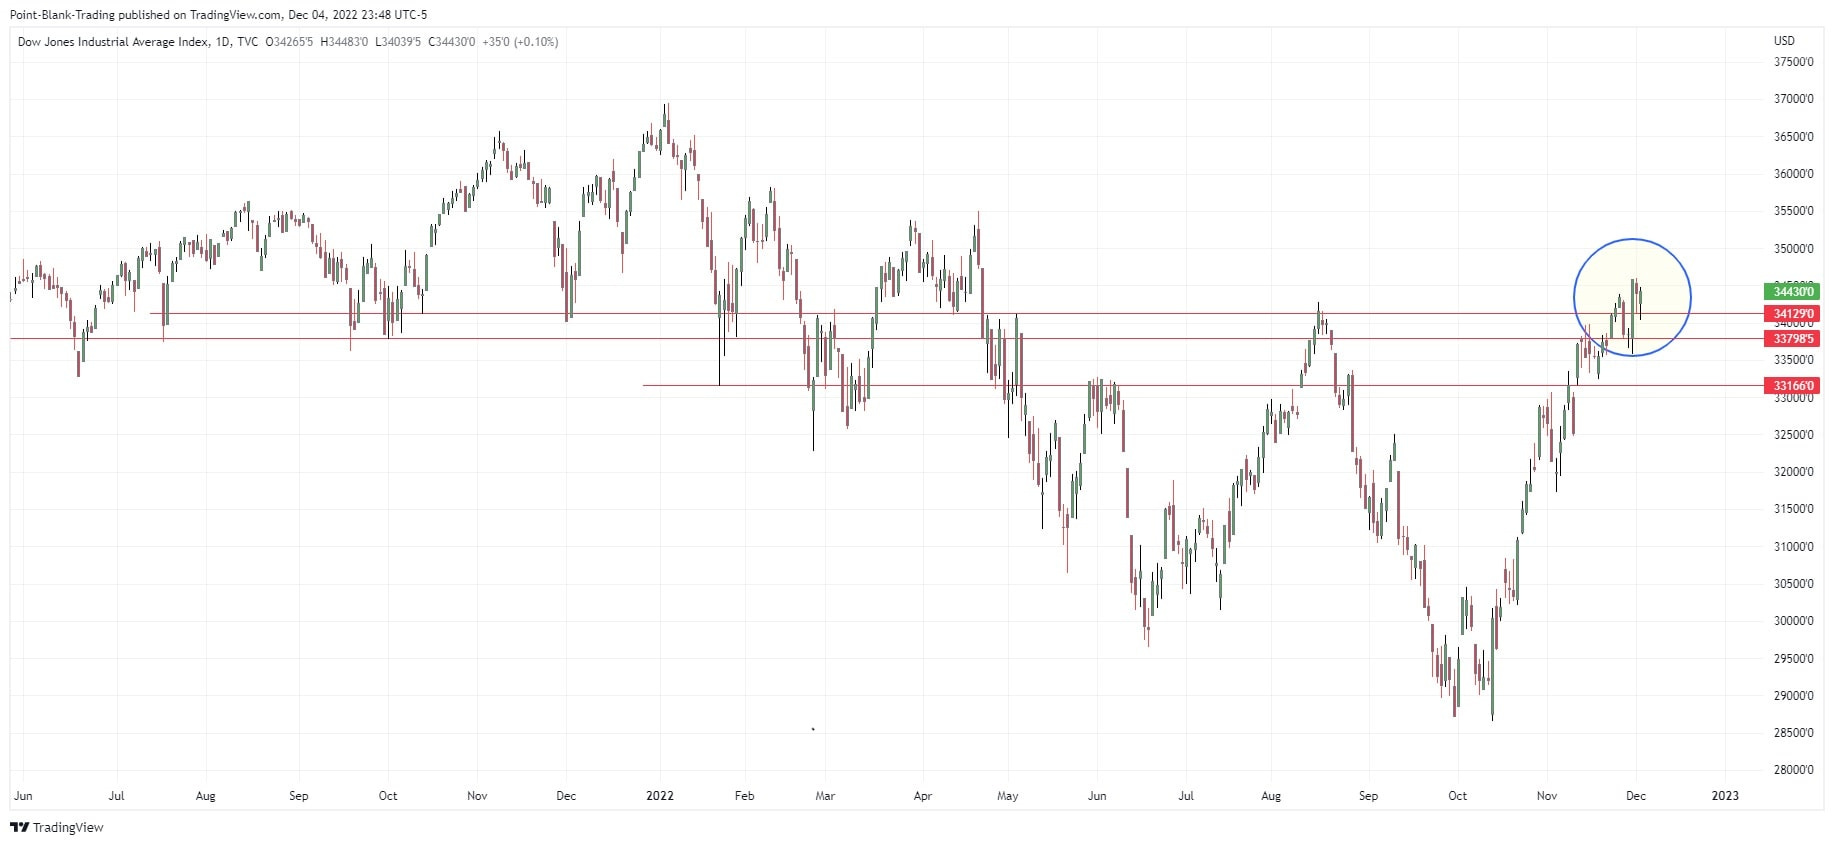
It is important to note something to keep in mind: The Dow Jone Transportation (DJT) which was a leader in showing the bullish path by presenting positive divergences with the Dow Jones Industrial (DJI), is now presenting negative divergences as it has yet to break above its August highs, let alone its November highs. Normally this divergence would indicate that a DJI pullback would be imminent.
This does not mean that DJI would go for a new bearish leg, but it does mean that a pullback would be on the menu until these two indices get in sync. We will be monitoring this in hopes that DJT catches up to DJI before a pullback occurs.

RUT / IWM / RTY
The Russell 2000 small cap index (RUT), as well as its futures (RTY) and its ETF (IWM) managed, as we expected, to close above the critical 200DMA and bounce from it after last Friday's initial drop.
They have yet to break above the November highs to look more bullish and continue the upward move.
The small cap index, after being along with DJI one of the leaders of this rally, it has lagged and is now behind the SPX.
NDX / QQQ / NQ
Last week we wrote:
“The technology sector remains one of the weakest sectors in this rally.
Neither NDX, QQQ nor NQ have managed to exceed the 100DMA. We expect them to do so this week, with the QQQ looking for the 293/295 area.”
All of them NDX, QQQ, NQ managed to close above the 100DMA, and despite Friday's drop below it they recovered and closed above that level.
It is important that, despite the prevailing weakness in the sector, this conquered level is maintained.
When we wrote the last newsletter QQQ was at 287, as expected the QQQ hit 293.5 on Wednesday and 296 on Thursday.
FAANG
Last week we said we expected the FAANG stock index to break above the 50DMA. All the major indices have been well above that level for a while now.
Given the weight the FAANG have in the market it is important to see this index achieve these targets.
As we expected that goal was achieved.
Something very positive for the FAANG is the bullish monthly candle it printed in November, which we expect to follow up on.
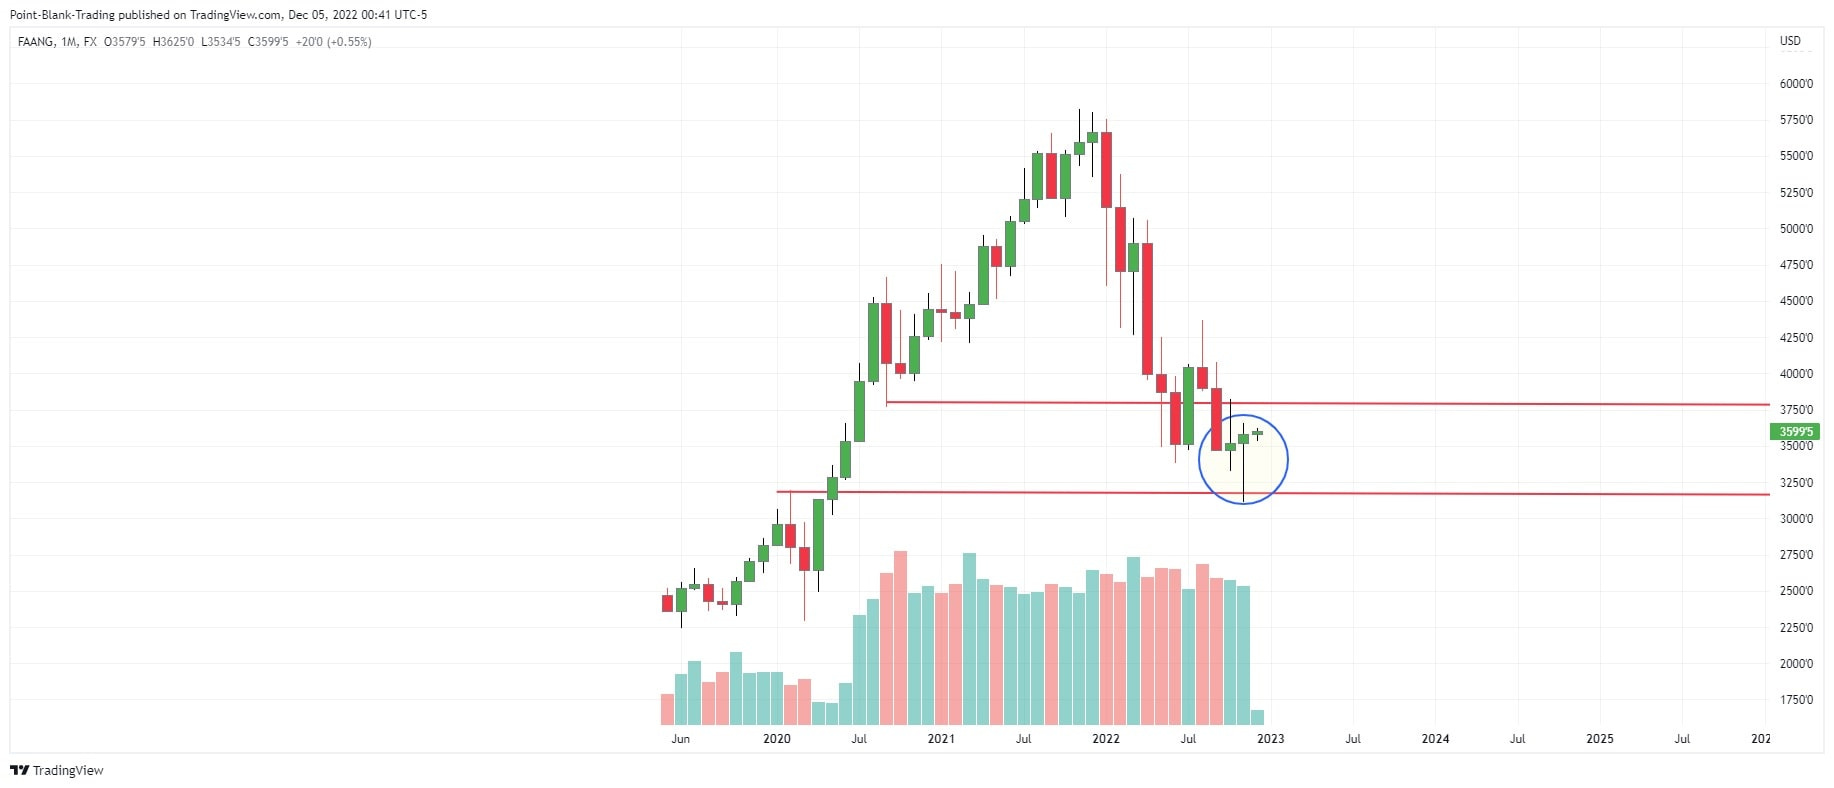
The best perfoming FAANG stocks were NFLX advancing 12.71% and META advancing 10.84%.
Our expectations that AAPL would be the best-performing stock failed due to conflicts over COVID in China.
SMH
The SMH Semiconductor ETF broke above the 200DMA for the first time since March, but failed to hold and closed below it on Friday. The November high coincides with that average increasing resistance in that area.
It still looks good, consolidating between 214 and 228. We don't want to see it close below 214.
The best performing stocks from this sector were LSCC advancing 3.17% and KLAC advancing 2.51%
VIX / VVIX
VIX continues to be trapped in a, at times difficult to understand, strong downtrend going lower even on days that SPX falls.
It has been printing red candles for 10 weeks in a row, which is quite a long period. It is to be expected to have even a dead cat bounce at some point in the near future.
We posted on our Twitter account a chart that if the patterns repeat would be indicating a strong rebound in the short term. However we do not believe that will be the case this time, yes it is possible that there will be a pullback in the market in the coming days, but we do not see it as a sustained move lower, unless an unexpected event occurs.
According to our long term regression channel, VIX failed to bounce off the mean and could be looking for the next support at 16.
VVIX is also trapped in a strong downtrend, but is holding above the November 22 lows. It seems to be consolidating between 76 and 88, the breakout of this range can be quite strong.

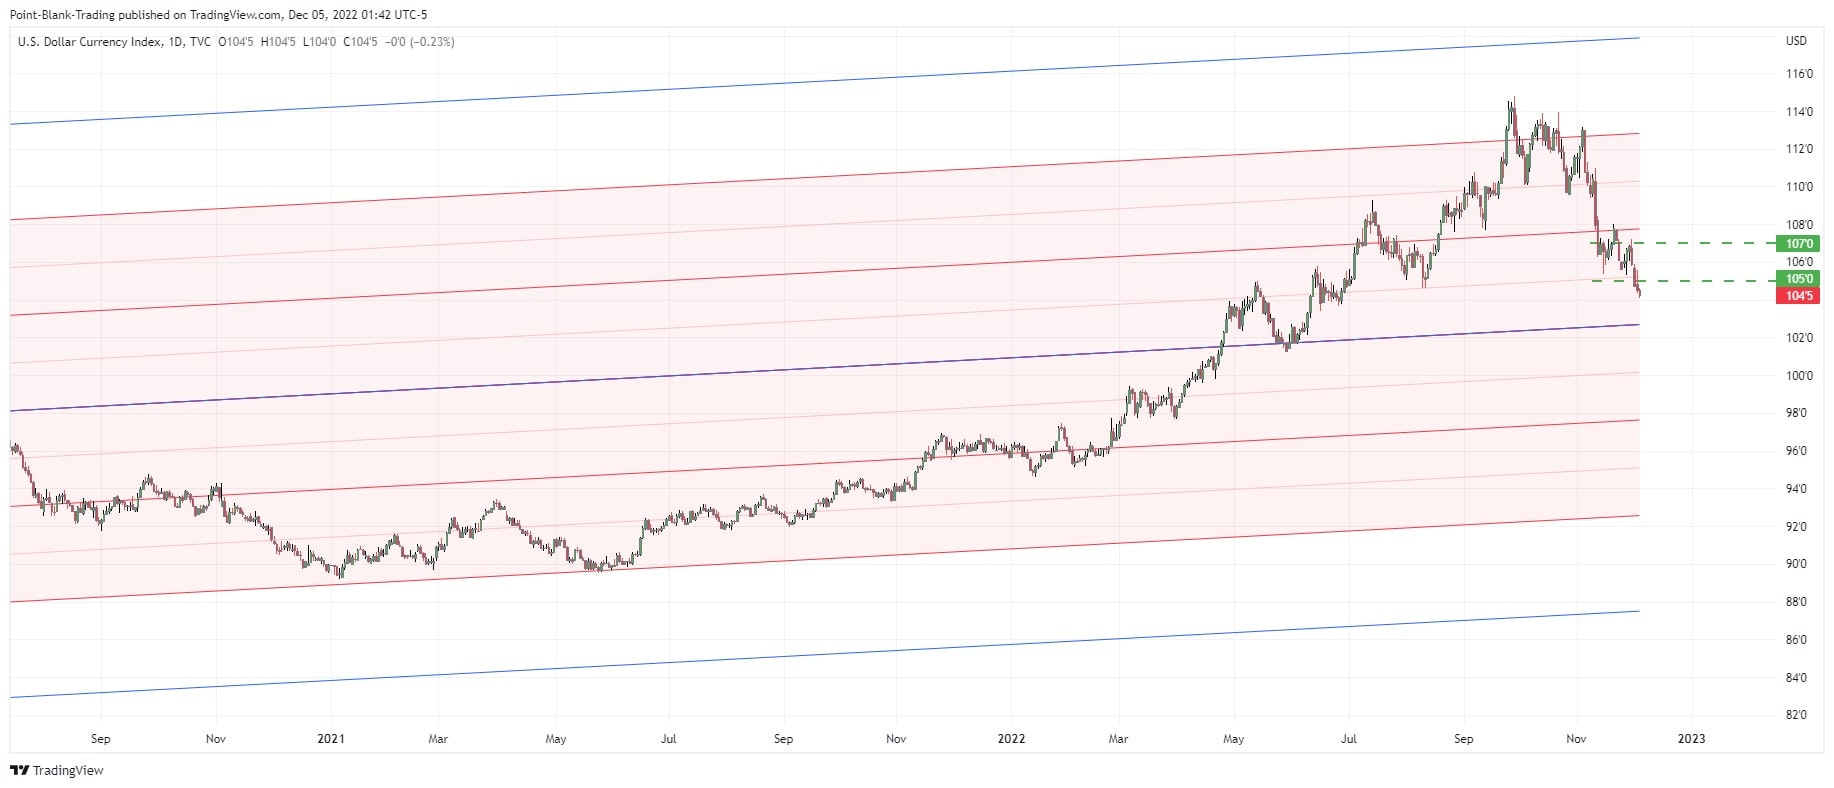
DXY
One of the factors that prompted us to offer bullish forecasts is the strong downtrend we have been following in the dollar index (DXY).
Our regression channels showed that this correction was due to occur when DXY was at 112.5. The failure to hold the channel supports led us to a forecast of 103 which is where the channel mean lies.
Even by overshooting to the upside at extreme levels outside the channel, a reversal beyond the mean could occur which could take it to 92.5 where the -2 stdev line is. This is quite common that when an asset has overshot so far towards one end of the channel, the correction will take it all the way to the other end.
Because it has overshot to the upside at extreme levels outside the channel, there could be a reversal beyond the mean that could take it to 92.5 where the -2 stdev line is. This is quite common that when an asset has overshot so far towards one end of the channel, the correction will take it to the other end, but we will be watching its behavior at each channel support level, currently the next one is 103 and then, if it fails, 100 would follow.
CLASSIC INDICATORS AND SPX
CCI: It is in overbought territory, pointing to the downside and still presents a negative divergence with the market. The weekly chart does not present divergences.
RSI: It is at 62.56, in an uptrend and shows no divergences or sell signals.
STOCHASTICS: It is in overbought territory, with no divergences or sell signals.
MACD: It is in uptrend and above zero. It is not oversold and its buy signal is still in place.
ROC: It bounced from the zero line last week, it is slightly pointing downwards and presents a negative divergence with the market. The weekly chart does not present any divergence.
WILLIAM'S % R: It went out of the overbought territory, but came back in, it shows no divergence or sell signals.
In conclusion, the classic indicators are more or less the same than last week. They remain positive and are mostly in overbought territory.
We will continue to monitor the divergences shown by the CCI and the ROC, but considering that the weekly charts do not show any divergence we will not give it more importance until some other indicator of this group shows some kind of weakness or sell signal.
MARKET BREADTH
The SPX stocks above 200DMA Index is still in great shape. It remains above its February, March and August highs. It is also above the 200DMA and the dominant trend line. Closed Friday at 62.5%, far from overbought.
As long as this indicator shows us that the internal health of the SPX is strong we will remain bullish.

The SPX stocks above 50DMA Index hit 92% last week, that’s overbought area. It does not mean SPX will tumble from here. This breadth indicator can hit higher marks and stay a little longer in overbougth territory before SPX begings a pullback. This extreme readings are not indication of market tops. We will continue to monitor its behavior and will alert you on our Twitter account of any dramatic change or signals of a reversal.
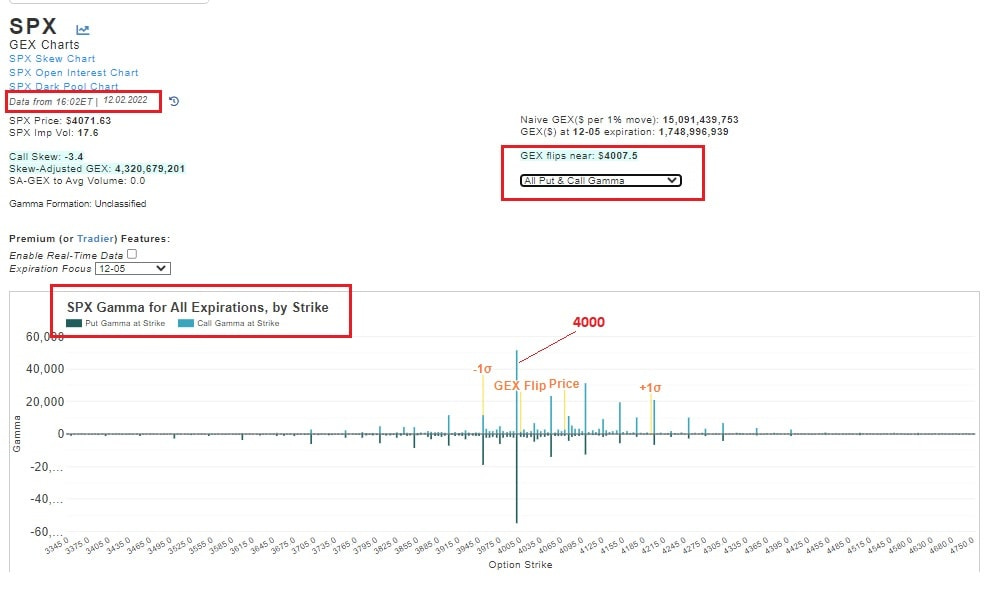
GAMMA Exposure.
Data and Charts from @TradeVolatility
The SPX net skew-adjusted Gamma for all expirations chart shows 4100 is the center of attraction for calls. Gamma is mostly positive with important stacks at 4150, 4200 and 4250 indicating traders have gotten more bullish and are placing higher bets.
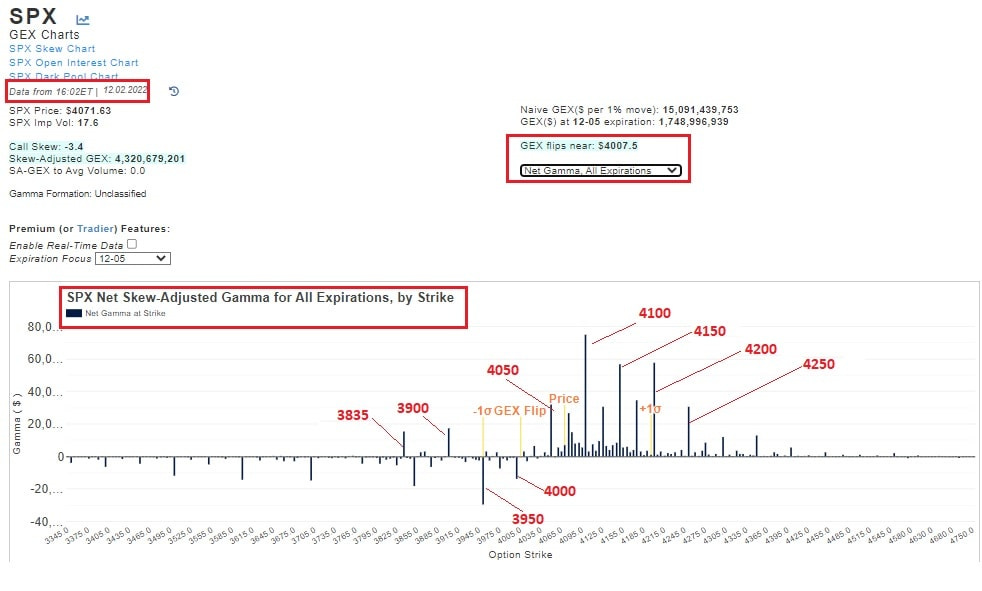
The SPX Gamma chart for all Puts and Calls, all expirations, shows that 4000 remains the Center of the Universe, and where the largest put and call OI is concentrated. Calls have grown in number and are outnumbering puts, this is not as bullish as it sounds. Call walls are being constructed that will stall the market advance.
Price is firmly in positive Gamma territory. This is positive since the best part of uptrends occur under a positive Gamma regime. It is important that the SPX stays above the Flip point or Gamma Zero point.
OUTLOOK
There are several factors that indicate a continuation of the rally in the days ahead:
•Last Wednesday, following Powell's speech the market launched into a strong rally that printed a significant bullish candle and caused many stocks and sectors to heal technical damage to their charts.
•That daily candlestick and the weekly candlesticks give a more bullish feel to the market.
•The strong downtrend in the dollar is something that favors an advance in the markets. Its correlation has increased in recent weeks.
•The market breadth has remained very healthy and in strong uptrend.
•Seasonality favors the continuation of the uptrend.
The concerning factors are:
•Many people are seeing SPX touching the trend line and VIX oversold and near support, this could invite a wave of sell orders that could cause a pullback.
•The SPX stocks above 50DMA Index closed above 90% on Wednesday entering overbought territory. On many occasions accessing that zone has marked a pullback in the SPX.
•Macro factors unfavoring the market are many, but although their short-term predictive power is not very reliable they are something to keep in mind.
•The Dow Jones Transportation index has lost its lead and is showing negative divergence with the current leader, the Dow Jones Industrials.
•The NYSE Advancers/Decliners remains in the green, but is trending lower. This does not mean anything until it turns negative.
•Several sectors remain weak.
•China and the compulsory confinements due to Covid continue to be a serious problem that produces a domino effect on the rest of the global economies.
•The Russia-Ukraine problem remains far from being resolved and at times seems to be getting worse.
Even so, we believe that although there is a chance of a pullback this week, the market will continue its upward march for the remainder of the year.
We expect that the SPX, after battling with the sellers that are supported by the trend line, will manage to solidly conquer the 4074 level and will enter the noise box, where despite turbulence it will manage to approach or touch the next target of 4181.
Wednesday's big bounce should, in theory, have a follow-through rally of about 60 points by Wednesday at the latest.
This week we will have the PPI which could cause some commotion in either direction. If it is to the downside, the market will recover and move on.
We once again recommend that you trade with caution, the waters are not as safe as they seem.
Have a good and productive trading week.