

It's the downtrend over?
It's the downtrend over?
Market comentary for the week from 28-08-23 to 01-09-23. Gamma charts and data from @TradeVolatility. Elaborated by the Point-Blank Trading team.

On July 27 SPX and the other major indices began a sharp downtrend whose low point, 4335.31, was printed on 8/18/23 two Fridays ago. The downturn began with a very bearish price action: a 1-day reversal that moved in an 80-point range. Since then there have been three other 1-day reversals, with the last one occurring last Friday. In addition to the reversals, there is a clear distribution pattern in place, and SPX has been relatively quick to break supports while being furiously rejected from resistance levels or its moving averages (20DMA and 50DMA). Price action has certainly been decisively bearish.
Surprisingly, if you will, on Friday in the face of bad news coming out of Powell's mouth at Jackson Hole, after an initial decline the market turned around and finished higher.
Is this positive move a change of sentiment and a sign that the downtrend is over? If so, how far will this bounce take us? Is it another bear trap?
Let's try to answer some questions:
Is the downtrend over?
No, the main trend is still down. At this time there is still no evidence that the trend has reversed, so long traders should be cautious. So far what we have is an oversold rally.
How far will the bounce take us?
SPX, the other indices and some sectors bounced in the past days, which is natural after the sharp decline, but they could be just oversold rallies, usually of short duration. These bounces usually stop or fail at 20DMA, currently at 4457.7 So that would be a critical level to watch and also at this time coincides with the 50DMA, currently at 4459.56, as it is about to cross it to the downside. This level is also coincident with the July highs (4458.47) .
We believe that 4450/4458 is the most crucial area to watch because of the confluence of resistances there. If this area is overcome it will be a very bullish move and indicative of a change in trend.

Is this another Bull trap?
If the distribution pattern continues, down days with high volume and up days with low volume, we are in the presence of another trap. Volumes should be reduced on down days and increased on up days.
How will we know if the downtrend is over?
An initial signal would be if SPX breaks above the current trend line, but especially if it manages to break above the 4450/4458 zone.
Another classic way to recognize a trend change is when higher lows and higher highs occur. If this Monday (08/28/23), as we expect, a pivot occurs, we would have the first higher low for the SPX, the higher high would be achieved when it crosses above 4458.
Is there a chance for the trend to reverse soon?
We particularly believe so, this is a conclusion we reached after analyzing the indices, different sectors and leading stocks. Many of them are bouncing from very important support levels, which gives a good impulse to this bounce. But we insist, as long as we do not exceed the 4450/4458 area the current downtrend will not be finished.
GAMMA
We utilize @TradeVolatility Gamma charts and data
One factor that we have not mentioned since all of the above is based on technical criteria, is the Gamma structure and the upcoming quarterly expiration.
On the one hand SPX remains under negative Gamma regime which as you all know tends to exacerbate moves because Market Makers have to hedge in the direction of the market, buying when the market rises and selling when the market falls.
For this Monday the Zero Gamma point (Flip point) is located at 4442.5, a level that should offer resistance.
At Friday's close the Gamma chart for all expirations shows a transition zone between 4415 and 4440. That entire zone, if it does not change, will be a hurdle and a struggle for SPX to cross.
As of Friday's close, the GEX structure for quarterly OPEX has changed quite a bit from having its primary focus at 4300 and 4350 to setting its sights on 4450, which is now the largest positive Gamma stack, followed by two negative stacks at 4600 and 4550.
OPEX Gamma is very dispersed, but as expiration approaches it will become more concentrated and offer a more regular profile. We will continue to watch.
**The Gamma described here is based on Friday’s closed. Today’s update changed the map. Please follow our X account @PointBlank_Algo to get the last GEX charts

VIX VVIX
On the volatility side the market can almost breathe easy at least on Monday and maybe Tuesday as well. VIX printed a twin candle on Friday, pattern that is usually followed by a move in the direction of the color of the second candle. That is, if the candle is red the next move has a very good chance of being down.
Neither VIX nor VVIX have been able to overcome their bearish demons: Trend lines, resistance levels and moving averages have stopped the advance of these indices every time they have tried to jump. VVIX closed in an area that has served as support several times, this does not mean that it will bounce (it could), but rather that it will hold without falling much further.
Charts check
SPX printed a bullish Harami candle on Friday on slightly lower volume and printed a bullish Harami candle on the weekly chart. It was rejected from 50DMA. 20DMA is about to cross below 50DMA.
SPY printed a bullish candle on higher volume on Friday, and a bullish Harami on the weekly chart.
ES printed a green candle on higher volume on Friday, and a bullish inverted hammer on the weekly chart. ES found support at the 20-week moving average.
NDX printed a green candle on slightly lower volume on Friday, and a bullish inverted hammer on the weekly.
IXIC (Nasdaq Composite) printed a green candle on Friday, a bullish Harami on the weekly chart.
QQQ printed a green candle on Friday with higher volume, and an inverted hammer with highet volume on the weekly chart.
NQ printed a neutral green cdandle with higher volume on Friday, and a bullish inverted hammer on the weekly chart.
DJI: Green candle on Friday, and a bearish hammer on the weekly chart. DJI found support at the 20-week moving average.
DIA: Green hammer with similar volume to the day before, and a weekly bearish red hammer with lower volume.
YM: Green neutral candle on higher volume last Friday, and bearish red hammer with lower volume on the weekly chart.
RTY Bullish green hammer last Friday, small red weekly hammer.
RUT Bullish green hammer, and weekly small red hammer.
IWM Red dragonfly doji on heavier volume, and a weekly mini red hammer on lighter volume.
DJT We are waiting DJT to stay above 15530
SMH green bullish inverted hammer with higher volume.
XHB bounced from strong support, but its weekly or monthly candles are not as auspicious.
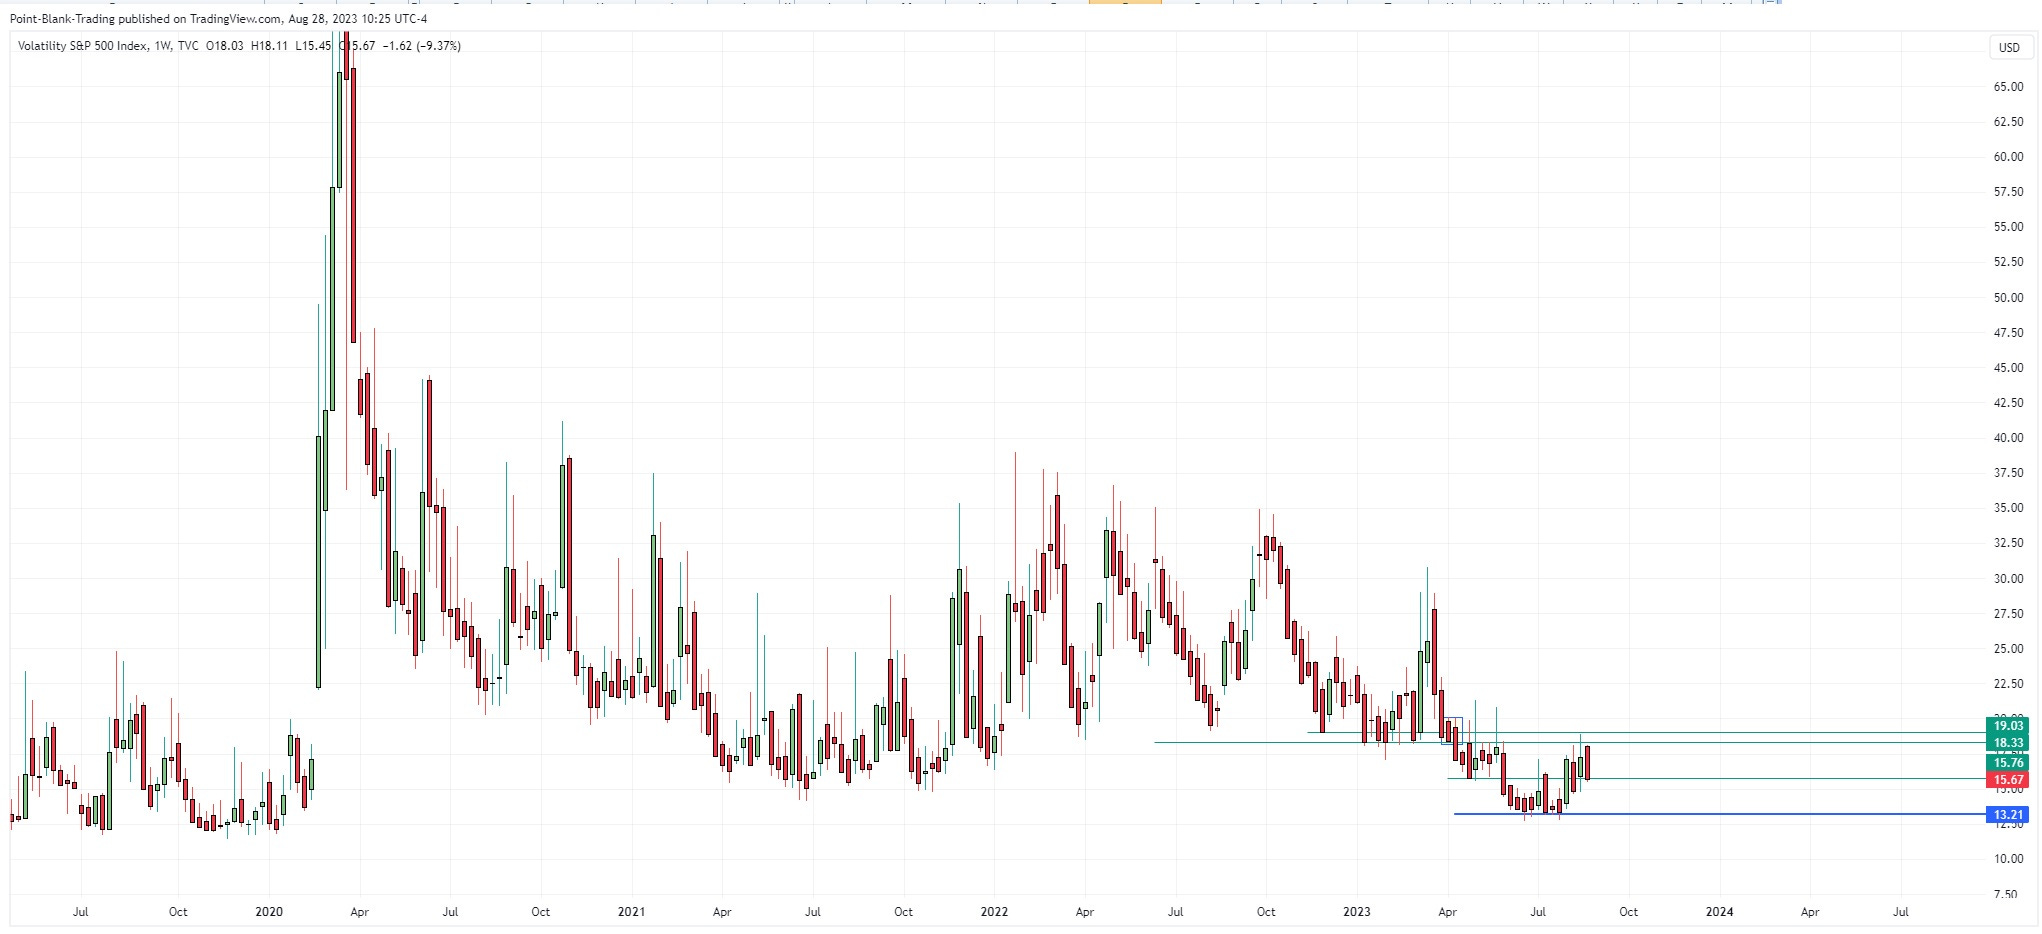
VIX printed a bearish twin candle on Friday, and a bearish engulfing candle on the weekly chart.
VVIX printed a bearish red candle last Friday, and a red neutral candle on the weekly chart. The monthly shows a bearish shooting star candle.
LEVELS TO WATCH
SPX, Initial support: 4360, Final support: 4300; Initial resistance: 4435; Final resistance: 4450/4458
SPY, Initial support: 436, Final support: 430; Initial resistance: 440; Final resitance: 445
ES, Initial support: 4365, Final support: 4340; Initial resistance: 4444; Final resistance: 4487
DJI, Initial resistance 34588; Final resistance: 34660/34695
DIA, Initial support: 340/ 341; Final support: 337; Initial Resistance: 347; Final resistance: 350
YM, Initial support: 34060; Support: 33920; Final Support: 33460; Resistance: 34890. Final resistance: 35400
IXIC, Nasdaq Composite Initial support: 13325; Final support: 13290; Initial resistance: 13800; Final resistance: 14300
NDX, Initial support 14550; Final support:14500 Initial resistance: 15280, Final resistance: 15750
QQQ, 355/358 Initial support: 358.5; Final support: 354.5Initial resistance 366; Final resistance: 373 376.7
RUT, Expected range: 1800/1920
IWM, Expected range: 181/190; Final support: 179; Final Resistance: 189
RTY, Expected range:1800/1926
DXY, We expect the dollar to stay below 104.5 with support at 103.5/103
XTN, We expect XTN to stay between 78 and 82 this week.
TNX, We expect TNX to remain in the range between 4.18 and 4.35 this week. A break above 4.34 would be quite bearish for equities, and a break below 4.18 would be bullish
Conclusions:
•We expect SPX futures to open higher on Sunday (See our NEXT WEEK,
https://twitter.com/PointBlank_Algo/status/1695898346521510061?s=20 )
•We expect SPX to open positive and close positive on Monday
•We expect SPX to visit and be rejected from the 4450/4458 area where there is a confluence of resistance levels, plus the 20DMA and 50DMA
•Not sure if SPX will be able to cross above the 4450/4458 area, but we will watching closely since that crossing would be a game changer
•Keeping an eye on SPX and its current trendline, it may hit it on Monday and/or Tuiresday at around 4435
•We think the market has a chance to advance this week and change the tone, but need to see evidence that this bounce is not just an oversold rally or a bull trap, so far bears are ruling