

New lows or new bounce?
New lows or new bounce?
Market Commentary for the week 09/06/22 to 09/09/22 - Issue No. 13 - Analysis and Outlook Elaborated by @PointBlank_Algo. GEX charts and data by @TradeVolatility

REVIEW
Bears markets are treacherous and deceptive. They turn when you least expect them, look strong and fall like rocks, look weak and fly like rockets.
Two weeks ago the market looked very bullish and very strong. The DJI and IWM had managed to break above their 200DMAs and their downward trend lines. SPX and Nasdaq on track to achieve the same feat. Nasdaq was the index furthest away from those levels.
On Tuesday, August 16, as soon as the SPX touched its confluent 200DMA and its downtrend line a wave of selling was unleashed that caused some notable cracks such as the break of the 1-hour and 4-hour trendline. Tuesday and Wednesday 17th the market withstood the onslaught of the bears and the bulls managed to hold their lines of defense. On Thursday 18th, in a surprise to many, the market launched a late afternoon rally reversing a negative day to a +58.5 point close, leaving traces of continuation the next day.
On Friday the market started upbeat and at 10:00am Powell kicked off with brief, but punch packed statements that unleashed an avalanche of sell orders that grew minute by minute producing a very ugly candle, it was the worst day for indices since May-18, 2022.
That huge, long, fat, bearish, red candle, which did not respect any support level but ran over every single attempt by the bulls to stop it, caused enormous technical damage not only to the indices, but also to many of the stocks that have led this and previous rallies.
It was very difficult to look at that candle and not think of lower prices. The results were not long in coming: on Monday the market fell -0.67%, on Tuesday -1.10%, on Wednesday -0.78%. On Thursday it managed to sustain the onslaught of the bears and defend the important band between 3900 and 3920, and not only that but it managed to close positive +0.30%, printing a candle that promised continuation. Its promise did not disappoint at least at the start of the day when the SPX reached 4018 (its 50DMA line) with a gain of 50+ points (+1.31%), and stayed there 1hr 45min without the bulls being able to push the price higher. At 12:30pm the bears took over and released the entire arsenal of sell orders they had in store managing to reverse the gains and push the index to a 1.07% loss. It was a 112 point end to end move. The indices managed to semi bounce off their support levels and close a little above their daily lows.
That move should come as no surprise when the gamma in the morning was showing its highest negative gamma peak between 3925 and 3960, and then piled up towards 3920 and 3925. “Coincidentially“ SPX closed that day at 3924.27 It should be remembered that usually in negative gamma regime the price tends to chase the higher gamma stack.
How much damage is on the charts? Are they repairable? Where are we headed? Let's check that out below.
ANALYSIS
Since the beginning of this bounce we have said that it has different characteristics than previous bounces. In June 16, with the SPX at 3642, the main factors that persuaded us to think we were touching temporary lows were extreme readings on market breadth and sentiment indicators, among others:
The % of SPX stocks below 50DMA
The % of SPX stocks below 200DMA
Cumulative Adv/Dec ratio
The cumulative AdvVol/DecVol ratio
The NewHighs/NewLows ratio
The extreme distance between the Gamma Zero Point and the price of the SPX
The equity only Put/Call ratio
Those extreme readings, which came to back up the support level found on our old market map, have historically been followed by strong - and in many cases long-lasting - bullish moves. The only thing missing was a stratospheric VIX.
From there the SPX launched a 14.63% advance rally; just to lose 8.85% in the last 13 sessions, and in the process violated or was rejected by its 20DMA, 50DMA, 100DMA and 200DMA.
With the indices so weak now and faced with the difficulty of finding bullish arguments we decided to look for how to support those unique extreme readings that triggered this rally. We found that one of the most advocated theories is the Breadth Thrust. Let's see what it is about.
According to Investopedia the Breadth indicators are mathematical formulas that measure the number of advancing and declining stocks, and/or their volume, to calculate the participation in a stock index's price movements. By evaluating how many stocks are increasing or decreasing in price, and how much volume these stocks are trading, breadth indicators help in confirming stock index price trends, or can warn of impending price reversals.
The best known breadth thrust indicator is the Zweig Breadth Thrus. It was developed by Martin Zweig, an American stock investor, financial analyst, and investment adviser. According to Zweig, the concept is based on the principle that the sudden change of money in the investment markets elevates stocks and signals increased liquidity.
A “Breadth Thrust” occurs when, during a 10-day period, the Breadth Thrust indicator rises from below 40% to above 61.5%. A “Thrust” indicates that the stock market has rapidly changed from an oversold condition to one of strength, but has not yet become overbought.
According to Dr. Zweig, there have only been [sixteen] Breadth Thrusts since 1945. The average gain following these fourteen Thrusts was 24.6% in an average time-frame of eleven months. Dr. Zweig also points out that most bull markets begin with a Breadth Thrust.
To calculate it you need the daily advancers and decliners on the NYSE. These are the formulas:
Breadth = AdvancingIssues / ( AdvancingIssues + DecliningIssues );
Zweig Breadth Thrust Indicator = A 10-day moving average of the breadth.
In this bounce the Thrust took 25 days. However in the May bounce the Thrust occurred in 11 days and since then, a number of chartists have analyzed these "just missed" signals and concluded that they are almost as good as the classic ZBT buy signal. Of those analyzed all but 2 of the 13 signals studied provided positive gains.

SPX and Zweig Breadth Thrust indicator
SPX Stocks above 50DMA
This is another indicator that can be used to provide Breadth Thrust signals. When 90% of the SPX stocks are above the 50DMA a signal is generated
Since 2007 this index has reached a value greater than 90% on 12 occasions, counted on a weekly chart and excluding readings that have been held for more than one week in a row, considering them as one reading.
All those extreme readings were followed by market rallies sometimes after a slight pullback. The exceptions were May 2009 and March 2010 when the market reversed after initial upward momentum (although in the long run it ended up going higher).
All the signals have been very productive if we evaluate the returns 12 or 24 months later.

SPX daily weekly chart with the SPX stocks above 50DMA index in log scale showing extreme readings
Its 'Reverse Breadth Thrust', a reading of extreme oversold conditions may prove to be a better indicator. Using 5% as a delimiter, we find that only 4 times since 2007 has this rate been so low: in the 2008 financial crisis (October); in the 2011 European debt crisis(August), in the 2020 Covid pandemic (March) and on June 16 of this year.
Each of those times the signal was followed by strong and long-lasting upward moves, with something of an exception in 2008. In 2008 SPX spent 7 weeks with this indicator below 5%. After overcoming that level, in a period of 15 weeks it had a small upward movement and finally a correction of more than 15% that marked the bottom of that bear market and started the secular bull market that has been going on for 13 years. In our case the SPX moved up more than 14%, and then corrected almost 9%. It’s the up move over?
Unfortunately the data is too short to give it much statistical validity, but due to the unusual or scarce nature of its signals, it would be worthwhile to keep an eye on it.
SPX stocks above 200DMA “Reverse Breadth Thrust“
Our favorite indicator of inner market health is the index of SPX stocks above 200DMA. We have always said that to give credibility to this or previous bounces we would have to see this index break above both its 200DMA and the 50% level.
That validation has not occurred. In early August this index managed to break the downtrend line that was in place since January 4. That was constructive. It then managed to break above its 200DMA, a short-lived achievement that barely lasted 3 days falling back below when it touched the 50% level and was automatically rejected. That happened on the same day that the SPX was rejected from its 200DMA. The index is currently back below the trend line that worked again as resistance last Friday.
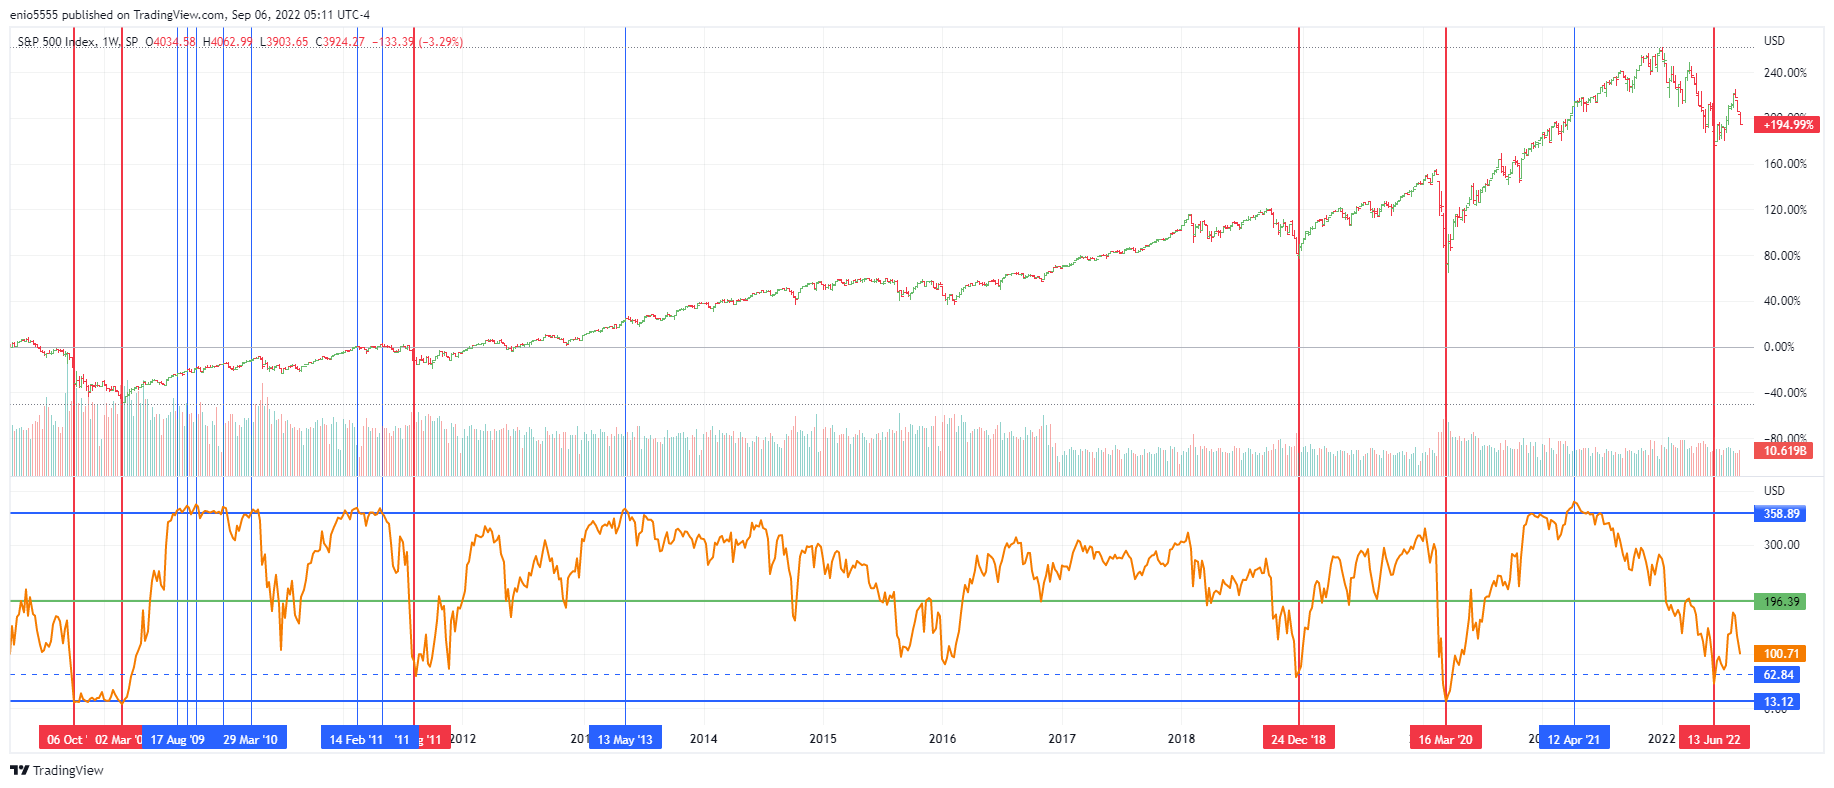
SPX weekly chart with SPX stocks above 200DMA index showing extreme readings
Like the SPX stock index above 50DMA, this index produces good signals on its extreme readings. Its signals above 90% are warning of overbought markets and may be followed by a pullback which is then followed by an uptrend. 12 or 24 months later returns are great.
Its readings below 15% are extremely oversold market signals and are usually followed by a strong uptrend. Since 2007 market events have provoked such readings: the great financial crisis of 2008 (2 signals), the European debt crisis of 2011, the China crisis in 2018, the Covid pandemy in 2020, and the last signal on June 13 of this year, it gave a reading of 11.48%. Previous signals were precursors to lasting uptrends, will this time be different?
Proponents of the Breadth Thrust make their case by comparing the current characteristics of the economy to past signals of this type and even to other bear markets. These are some of their arguments:
Personal Income Excluding current transfer receipts, always lower during recessions made a recent ATH
Total Nonfarm Payrolls, always lower during recessions, made a recent ATH
Employment Level Household Survey, always weak during recessions, is slowing but still in uptrend
Real Personal Consumption Expenditures still in uptrend
Real Manufacturing and Trade Industry sales are up
Industrial Production made a recent ATH
Manufacturing has been weak, but still near the top
In view of this data, they are adamant that the SPX will reach new highs very soon and take off in a new leg of the secular bull market.
They may be right about some things, but they are probably leaving out of the picture others issues whose discussion is beyond the scope of this newsletter: the growing geopolitical tensions, such as the Ukraine-Russia conflict, the China-Taiwan situation, the US-China tension, the Middle East-Iran problem, etc.
All the economic welfare they talk about is the product of QE, but now life will be under QT, etc
As a check we did a ratio with the two indices and the result is 5 extreme high reading signals, of which 2 were followed by pullbacks of several weeks before the upside moves began.
And there were 5 extreme down readings, 3 of which were during the process of bottoming out after the 2008 financial crisis and the other two were in the Covid pandemic and this year in June. What stands out is that after the June signal there was no rise towards the high reading zone and rather it is now at a fairly low reading, so there was not a market Breadth Thrust.
Let's play one move at a time and see what happens.

SPX weekly chart with the S5FI/S5TH ratio showing extreme readings
INDICES
DJI/DIA/YM
Closed slightly below Fib retracement 0.618
Bearish monthly candle
Bearish engulfing daily candle
Bounced off support twice, Thursday and Friday
It is below 20, 50, 100 and 200DMA
20DMA is pointing down
Regression Channels
Historical Channel (64+ years) :
Correlation 0.8654
Just entered inside the channel
Correction is not finished should fall below 27800
Long Term Channel (3400 days):
Correlation 0.9695
Price is between the mean and -1 stdev
Next resistance is the mean at 32640/32660
Mean was not support, sign of weakness
Long Term Channel (1658)
Correlation 0.9368
Closed at important support
The price has remained within the comfort zone, between +2 stdev and -2 stdev
NASDAQ/QQQ/NQ/NDX/IXIC
Nasdaq Composite (IXIC) Long Term Channel (1658 days):
Correlation 0.9265
Rallied to +2.5stdev corrected and hit -2.5stdev. Bounced in June and was rejected at -1std. Now it has poked its nose back below the Comfort Zone. If it doesn't come back soon it may go to 11220, and then to 10570.
QQQ Long Term Channel (1658 days):
Correlation 0.9355
Same moves than Composit, but closed at important support at -2.5stdev.
Long Term Channel (3366 days)
Correlation 0.9182
Sitting on very important support at the mean (It also closed at a Fib level)
SPX/EX/SPY
Historical Term Channel (64 years)
Correlation 0.8428
Historical channel indicates more correction is needed
Price needs return to Comfort Zone, below 3250
Long Term Channel (3366 days):
Correlation 0.9569
Closed slightly below the mean at 3940, it will be resistance in an up move (It close at a Fib level)
Next support, 3790 and more important 3660 (-1 stdev)
Long Term Channel (1658 days)
Correlation 0.9357
Rally rejected from the mean, signal of weakness
Price currently below -1 stdev
Next important support is -2 stdev line at 3800
CLASSIC INDICATORS
RSI is below 50, but is not oversold
CCI is oversold pointing up, but has not generated a buy signal
William's %R is oversold and pointing downward
Stochastics is oversold and pointing downward
ROC is below zero, but not oversold
MACD is in sell signal, but is not oversold
VIX
Since awakening broke above dominant trend line and important resistance levels.
It's above 20, 50, and 200DMA
VVIX
It remains trapped in the range it has been in since the SPX rally began on June, between 85 and 95. A breakout to the upside of that range will mean a strong upside move in VIX perhaps beyond 32 which is our initial target.
If it fails to break out of that range, it will be a drag on any attempt at a VIX rally.
GAMMA EXPOSURE - GEX
Chart and GEX data from @TradeVolatility
The gamma for the September 16 OPEX has begun to focus on strike 3900, of concern is the fact that the entire gamma is negative and has been chasing lower strikes since August 18.
The gamma for all expirations remains concentrated at strike 4000. Those spikes are harder to move. It is hopeful for the market to see that strike as the gravitational of total gamma.
The gamma for Monday’s expiration is concentrated in 3925, so if nothing changes, that would be the magneto attracting price.

OUTLOOK
Perhaps the most important event this week is James Powell's address (again) next Thursday at 10:00 am. Will his stance since Jackson Hole change even one bit, what new events might have happened or will happen to make him tone it down? It appears that nothing major has happened on that front, but we’ll see.
The other important announcement will be the PMI on Tuesday.
Thursday and Friday the indices managed to close above their support levels (both Fibs and horizontals), and that, if you will, is somewhat constructive, but the candles that formed with Friday's reversal are definitely bearish. The market may bounce this week, but in general it looks difficult for it to hold that floor. The question will be answered by J. Powell in his speech.
Examining the charts of the FAANG stocks we find a similar picture, except for NFLX and AMZN.
NVDA is at its lowest level so far this year. AMD has not reached the low of the year, but presents a definitely bearish chart.
Checking the sectors, basically all have the same chart. The only ones that look healthier are the energy sector XLE and Utilities XLU.
We must not forget that September has historically been a bearish month.
In conclusion looking at this dark outlook we will continue to do our short term trading based mainly on price action and following the short term trend as indicated by the 63 day and 127 day regression channels and our slope indicator. Thus, the 63-day channel is still ascending, but losing steepness rapidly, has a decreasing slope and the 127-day channel is descending with a flattening momentum.
In answer to the question bounce or new lows, we found some valid arguments from the proponents of the Breadth Thrust theory, but aside from the fact that the sample is not large enough to give it more statistical validity we have that the Thrust does not improve the conditions that pushed this market down. We wrote in a past newsletter that the only thing that can stop this bear market is what caused it: INFLATION. Until it comes down or gives clear signs that it will come down, all the ill effects that come with it will be reflected in the market. If inflation subsides the market will go up, there is no doubt about it, with or without Thrust. If inflation remains sticky, the correction will continue because of the obligatory continuation of rate hikes and their dire consequences for the economy.
Our historical regression channels of the indices clearly point out that the markets remain overextended and need to go lower to return to the channel Comfort Zone that lies between +2 and -2 stdev. That is where at least 95% of all price occurrences must occur. SPX is still above +3 stdev in that channel. The only alternative is that it stay out of the channel so long that the bands end up expanding and adapting to the new prices. This is a 3360 week channel (± 64 years), so SPX would need to spend a few years out of the channel for that to happen.
We think there is a good chance that in this recent leg down we will not go directly to the June’s lows, and that the market will try to attack again its moving averages especially the 200DMA, then we will see. However, any bounce from the current level will have to fight first with the 50DMA and then with the 20DMA before even thinking about the 200DMA.
We will wait to see how it plays out this week with Powell's conference on Thursday.
Caution is advised whether you are short or long. These markets are deceptive and may harm bulls or bears.