

Noise Box, bear and bull traps
Noise Box, bear and bull traps
Market Commentary for the week from 05/07/2023 to 05/12/23. Gamma data from @TradeVolatility


REVIEW
For weeks the market has remained in a well defined trading range. We call it The Noise Box and define it between 4074 and 4181. The first time we wrote about the noise box was in June 2022, at that time SPX had been up and down for about 6 days without being able to break out of the range and we wrote "be patient, whichever way SPX breaks out, a long move will follow". On day 9 SPX broke below and produced a move for the record book, it was one of the very rare occasions that the SPX dropped more than 2% for 3 consecutive days, it was also a record drop: 11% in 6 days. That gave credibility and relevance to the Noise Box.
When SPX, after the bounce from the June lows, managed to reach this area again, we started to write day by day about the Noise Box and recommended again to be patient, to wait for a breakout from either side to take a position. Surprisingly SPX stayed in the box for exactly 9 days just like the first time. It broke out at the top and soared for 5 days, moving 142 points to 4323, the August 2022 high, an area we have not visited since.
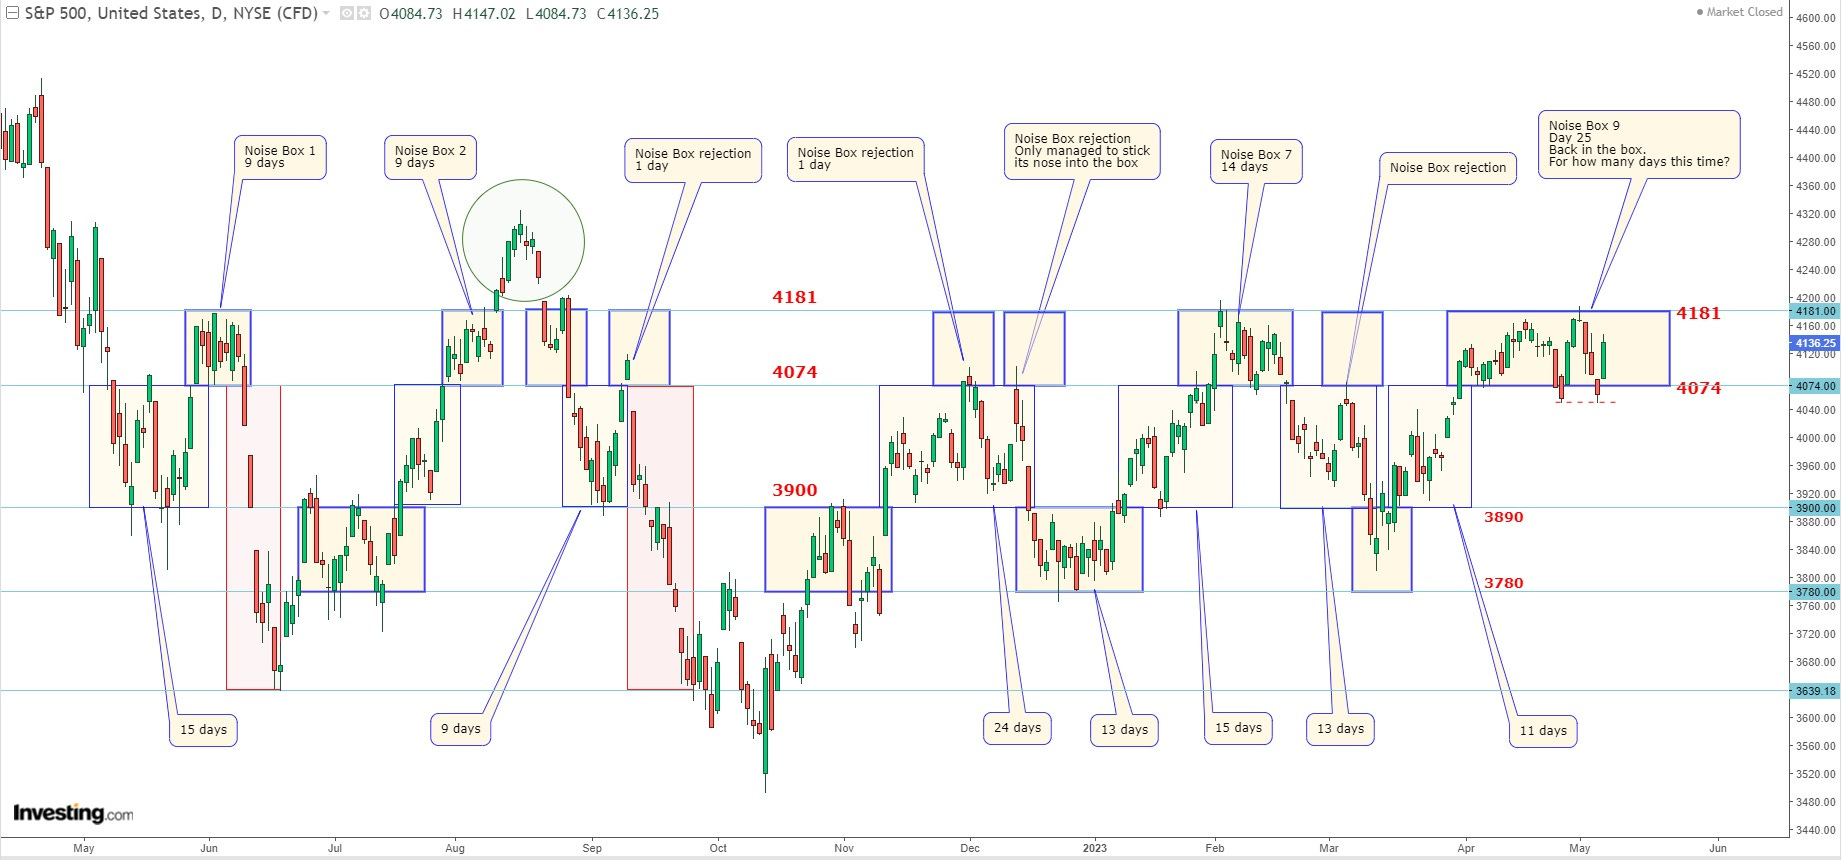
Little did we know in all the posts we have done on the Noise Box that SPX could stay there for 25 days (the longest stay had been 14 days). That's how long it has been in the box now, a time in which it has made extreme moves, and in which it has so far set two bear traps and one bull trap. Not surprising considering that in our days false breakouts are a common and constant occurrence.
We can be sure, that after this long consolidation the next solid breakout out of the box, either on the upside or the downside, will be followed by an explosive move. At this point in time the momentum looks like SPX will look to break higher, but it is not yet clear if it will be able to do so.
Which way will SPX go?
ANALYSIS
From the technical point of view there are some problems. There is a distribution process that is not so visible, but it is evident at times. The indices go down on high volume and go up on low volume. This phenomenon is seen on both daily and weekly charts. It is not the type of action you want to see during a bullish leg. Last Friday's Nasdaq was the exception.
Nasdaq, the undisputed leader of this rally, managed to close Friday and the week in the positive and on higher volume. That is constructive for the uptrend, Nasdaq can continue to lead until it fails, so we will keep an eye on it. Another positive factor on Nasdaq's part is that the Nasdaq Composite caught up with the Nasdaq 100, thus healing the negative divergences they had between the two and indicating that market participation has somewhat increased.
There are some negative divergences between the major indices and the classic indicators, but these are healing and should be resolved with a couple more days of upside.
There are two negative divergences that in our opinion are worth paying attention to: The first is the divergence between DJI and DJT. The Dow Jones Industrials is the healthiest of the major indices from a breadth standpoint, but Transportation is one of the hardest hit, followed only by IWM. We had as an example the warnings issued a couple of weeks ago by UPS and , and JB Hunt (JBHT) a large trucking and intermodal firm.
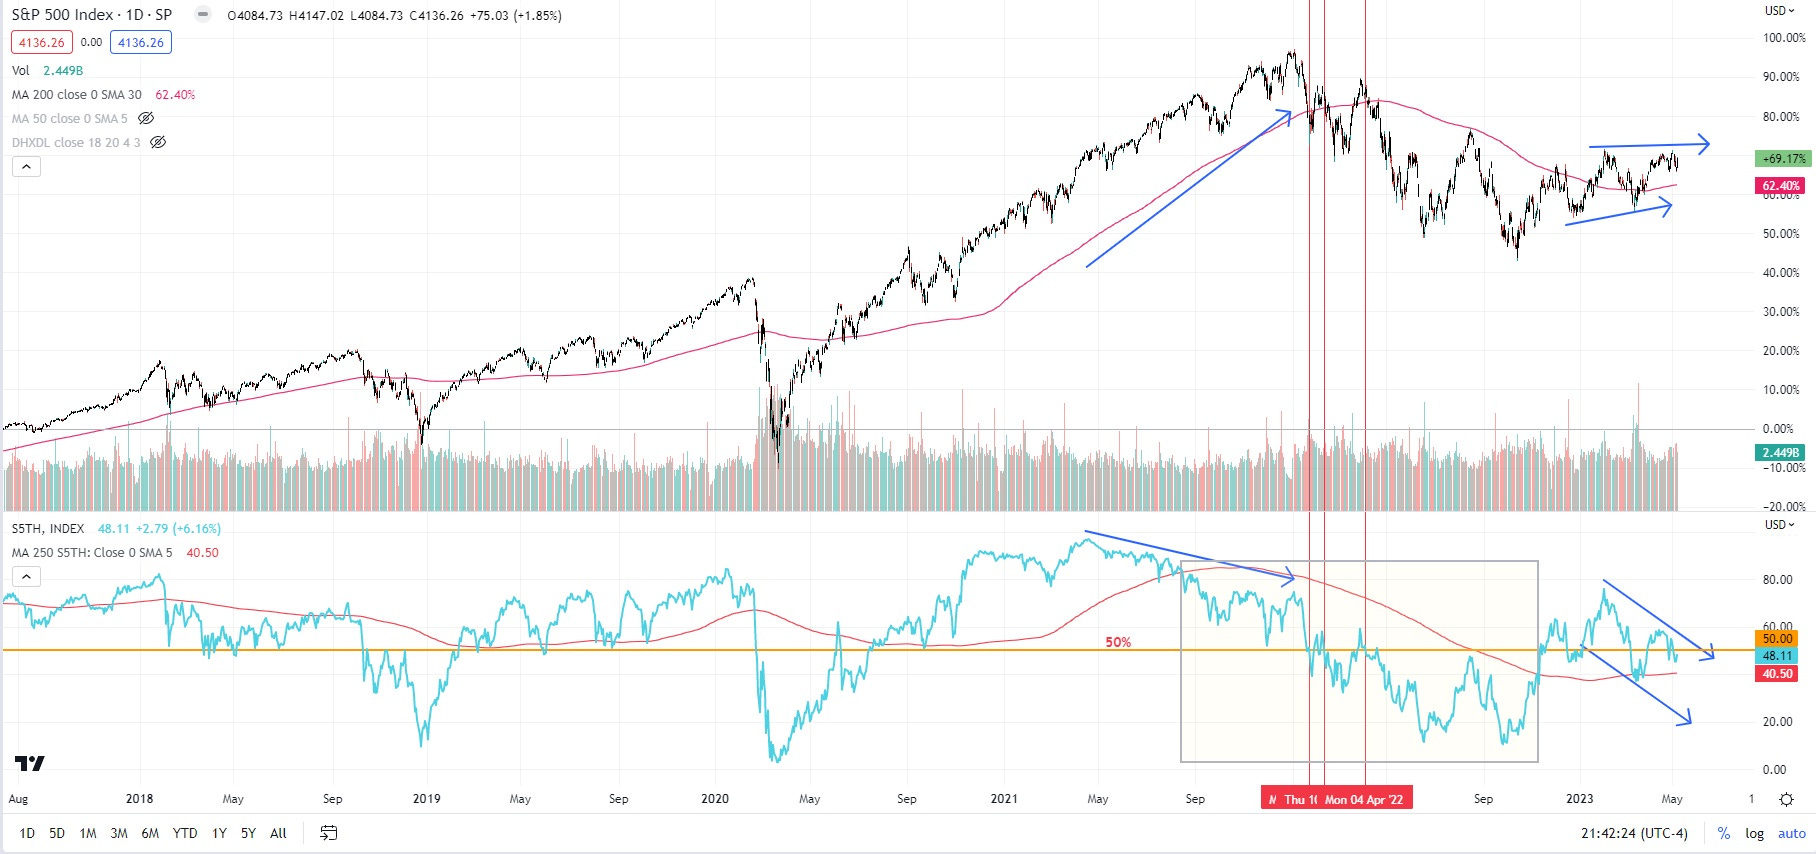
he second negative divergence, and one that in our view has a lot of relevance, is the one between the SPX and S5TH, the index of SPX stocks above 200DMA. While SPX has managed, after the February high, to print higher lows and higher highs, S5TH has printed lower lows and lower highs. These divergences can take time, even months. The favorable thing for the SPX is that for S5TH to generate an SPX sell signal it would have to meet 2 main conditions: falling below the 200DMA and the critical 50% level. We can add falling below its dominant trend line. Meeting one condition indicates a weak, but not totally defeated SPX. Right now S5TH has had trouble crossing above its most recent trendline, but remains above the trendline that ruled April 2021; and is below the important 50%, but remains above its 200DMA from where it bounced on Thursday.
One of the events that in our eyes was one of the most bullish of the week was the Island Reversal pattern generated by SPX, DIA, QQQ and several leading stocks in the market. Some traders may call it the Abandoned Baby pattern, but the effect is the same. Violation of the low of the lowest candle cancels the pattern.
VIX, VVIX and VIX1D
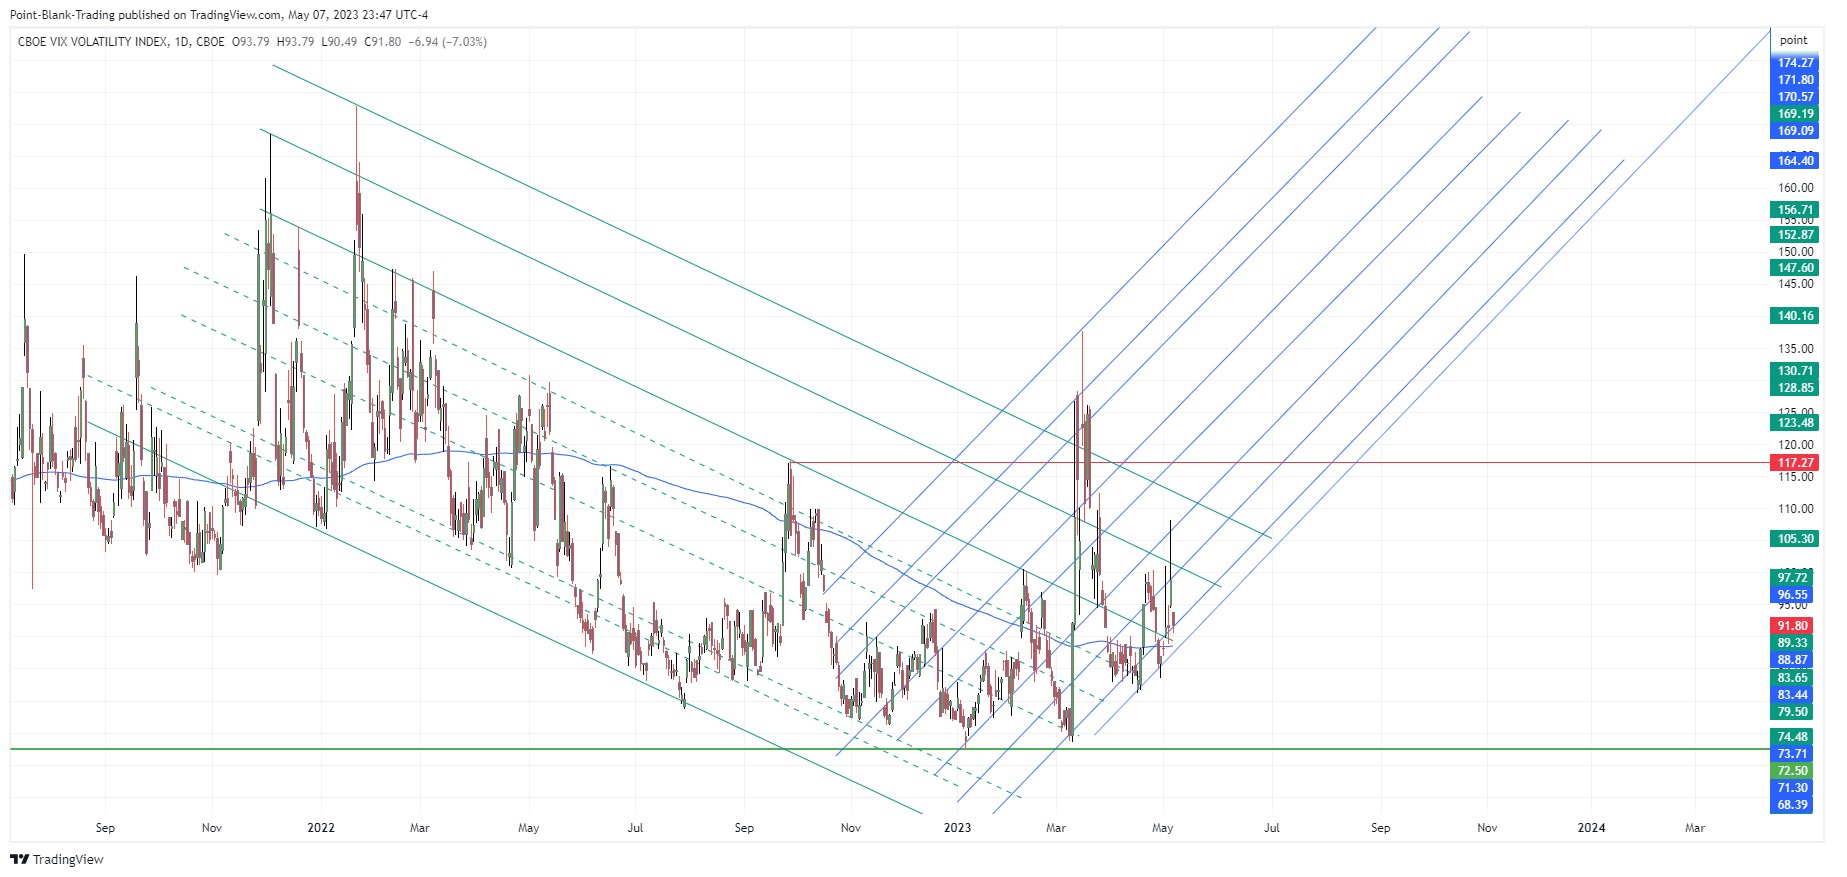
VIX still remains within a strong downtrend from which it does not quite get out of despite some good attempts. In fact, according to metrics that we use so many times in the past, VIX generated last Friday a strong buy signal on the SPX. The signals generated by this metric still have a good degree of reliability, and are actionable. The signal would become invalid if VIX closes above 20. Usually the signal is followed by a SPX rally within 3 (max. 4) days after the signal. But also, it is not uncommon to see SPX make a pullback that can range from slight to significant without going below the low of the day the signal was generated, if it does the signal becomes invalid.
VVIX on the other hand seems to be in better shape and has started on a path that could well turn into a volatility explosion. We have always considered VVIX as a precursor of what is to come in volatility, so we will be watching closely. This is a caution signal regarding the rally.
VIX1D fell below the important 14.57 level, indicating that daily volatility returned to subdued levels on Friday.
GAMMA
For almost all the expirations of the week, there is a lot of call Open Interest at two strikes: 4150 and 4200. With SPX close at 4136 we have to considered 4150 and 4200 as very important resitance levels.
NEWS
The narrative of the regional bank crisis, the debt ceiling, the CPI numbers and the FEDs speaking this week will all have their impact on the market. If no bad news comes out of those fronts SPX will try to reach its February high at 4195.
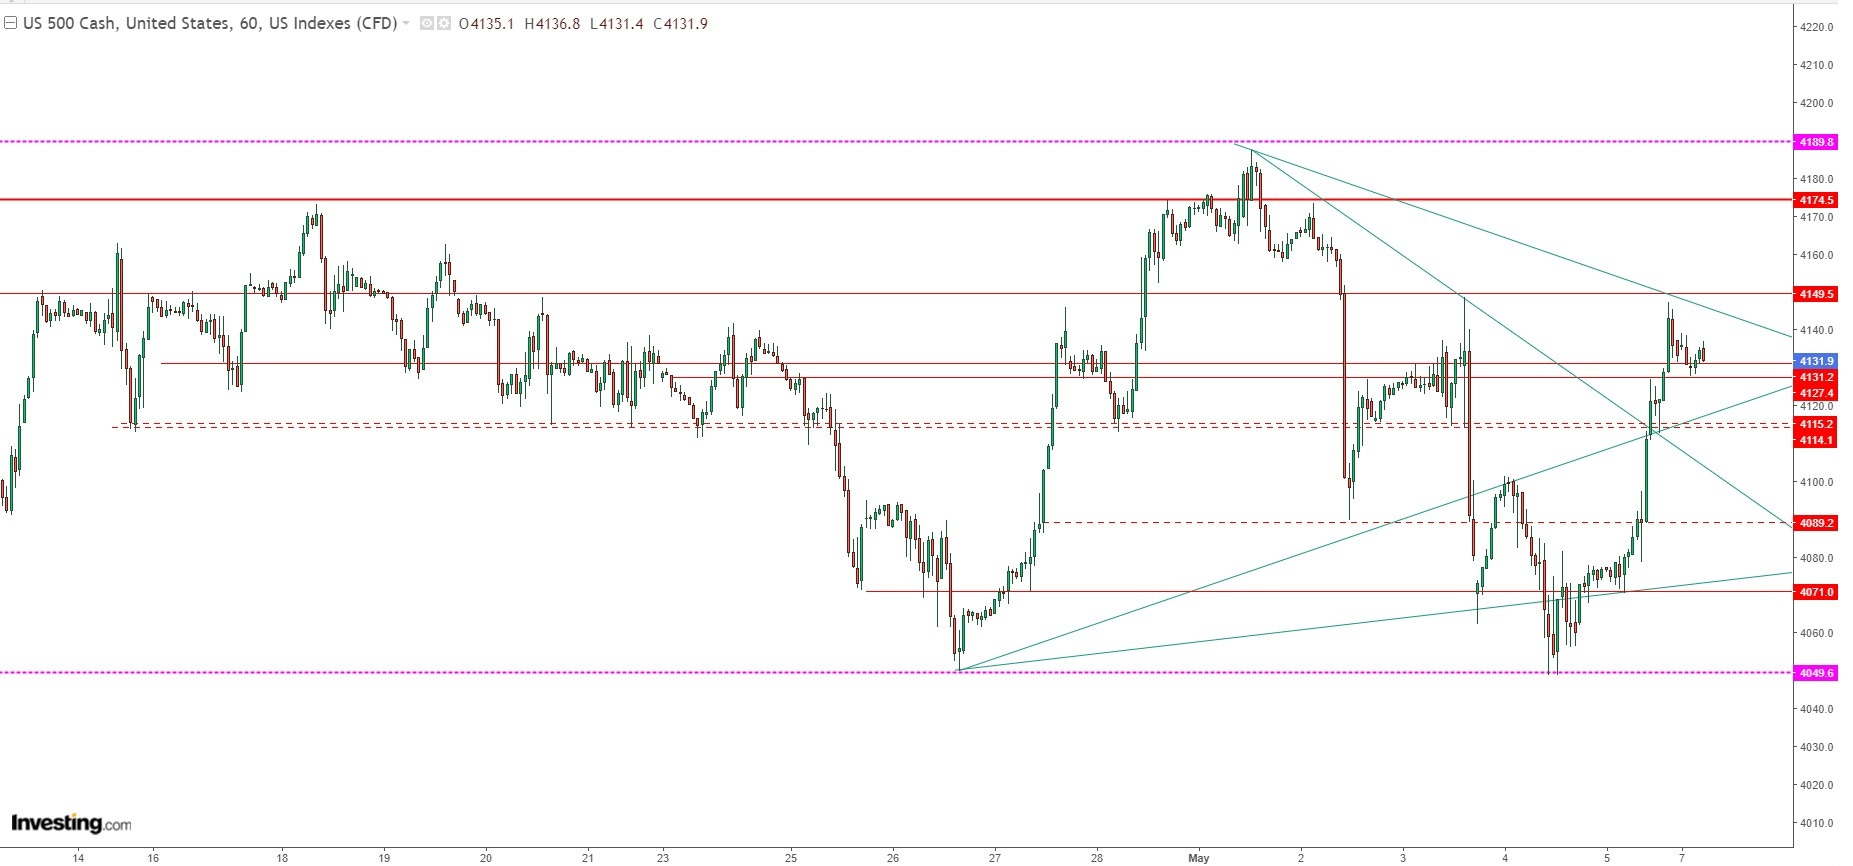
LEVELS TO WATCH
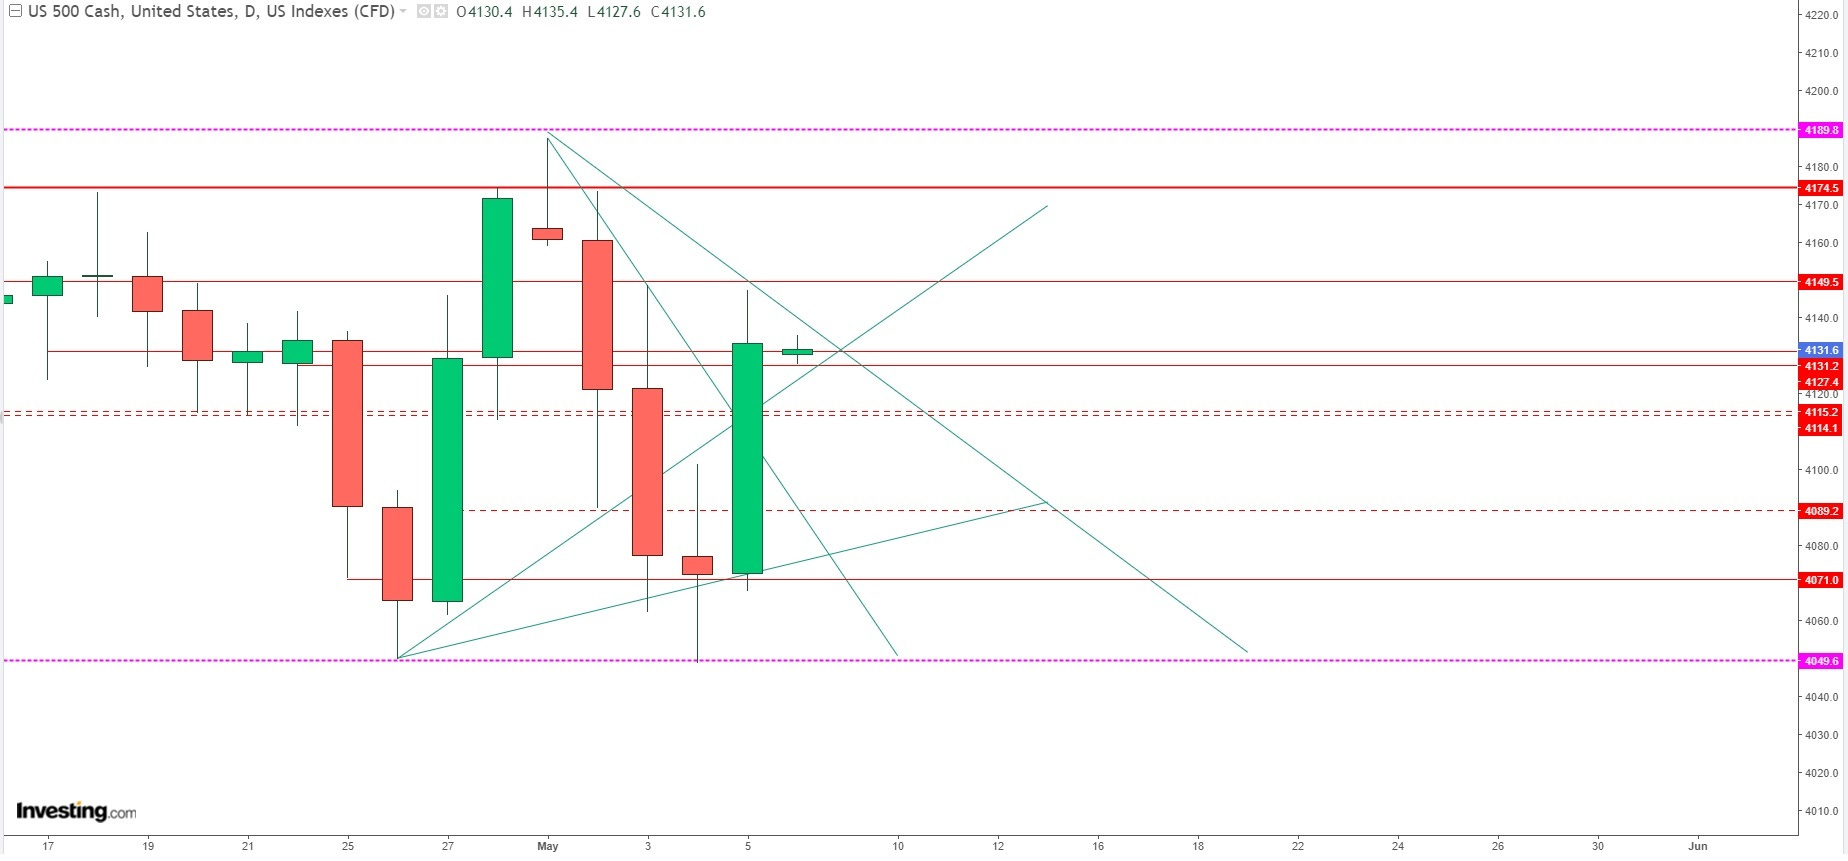
Considering Gamma, the important levels to watch this week are the obvious 4100, 4135, 4150, 4175 and 4200, with more relevance in 4150 and 4200.
From a technical point of view the most important levels are as follows
Extreme levels: 4190 / 4050
Intermediate levels: 4070, 4090, 4115, 4135, 4150 and 4175
4150 will be strong resistance to overcome, but remember that with the right catalyst there are no invincible supports or resistance levels.
The levels to watch will be update every morning.
We wish you a very productive week, be careful and cut your losses quickly. See you soon.