

Powell, CPI, Earnings season. Where are we going?
Powell, CPI, Earnings season. Where are we going?
Market Commentary for the week from 01/09/23 to 01/13/23 • Issue No. 23 • Analysis and Outlook elaborated by @PointBlank_Algo • GEX charts and data by @TradeVolatility

REVIEW
We are back after 18 days on vacation, almost 100% unplugged. A needed breake.
When we left on vacation on December 19th the SPX closed at 3817, and now that we are catching up we notice that it basically did not do much in that period, it stayed in a range of about 100 points, but with average movements of 34 points per day. SPX spent about 13 trading days in consolidation, in a congestion zone, or as we like to call it trapped in a Noise Box. Friday afternoon, however, when we returned we were met with a big welcome rally. Thank you Mr. Market.
Our last December bulletin was produced in the week of the CPI announcement, coincidentally this first bulletin of the year is also prior to the CPI numbers that will be announced next Thursday morning. Important to see what it brings. Presumably it will be soft numbers, but let's not forget that in December after an initial rally on the back of the favorable CPI number, the market reversed and then barely managed to recover some of the initial big gains. Then the next day came the FOMC, the rate hike and the rally-killer lecture by Powell who took pains to play his hawkish role sending the market sharply lower in the following sessions.
This week we will first have Powell on Tuesday and then the CPI on Thursday. We will see how the market reacts. In the meantime let's take a look at the charts to see what clues they give us about the path they will follow this week.
ANALYSIS
SPX / SPY / ES
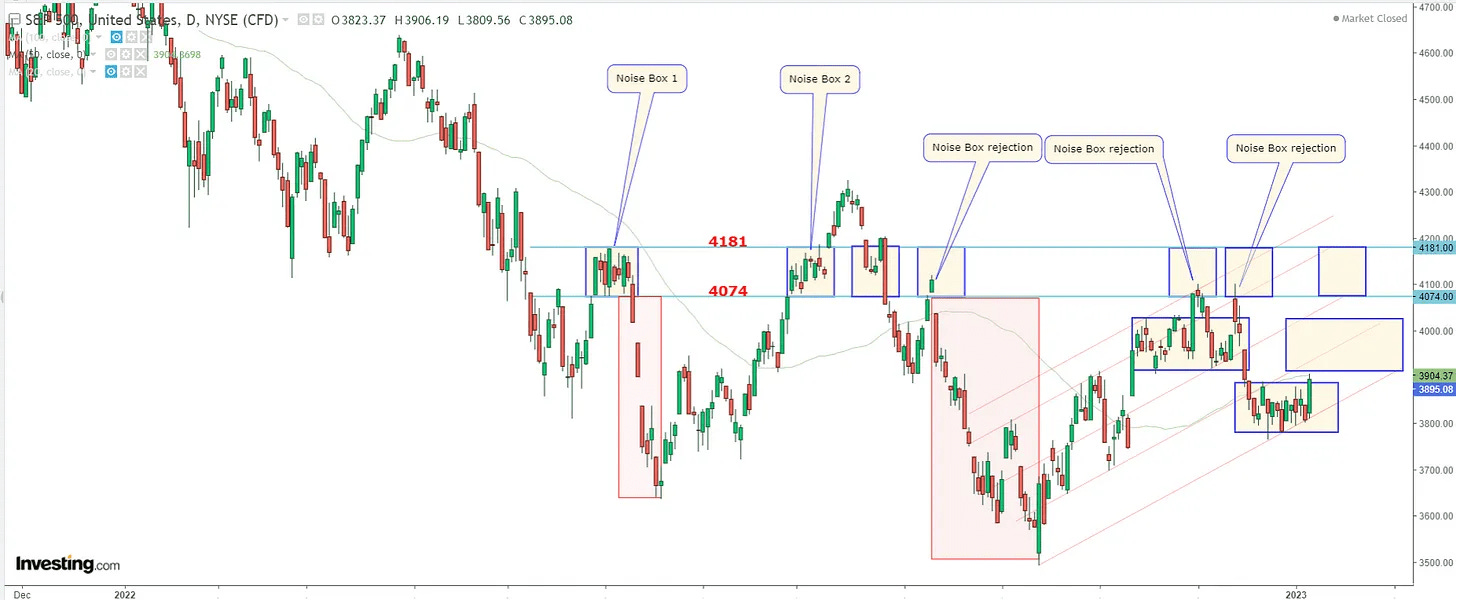
SPX has been trapped in a Noise Box (a consolidation or congestion zone) for the last 14 days, roughly between 3780 and 3890. Despite this wide range during the 13 trading days from December 1th through last Thursday the SPX only moved an average of 34 points per day. As on previous occasions our recommendation is to wait for SPX to come out of the box, whichever side it comes out of should be followed by a larger move. It is to be noted that the actual height of the current Noise Box is the same as the May/June box from
Last Friday SPX managed, after initially dropping and testing the 3805 area, to bounce and impose a rally of 87 points or 2.28%, driven by labor market numbers indicating a decrease in wages, managing to poke its nose out of the noise box and to close above its 20DMA and a little above 100DMA. The high of the day coincided with 50DMA which represents an immediate hurdle. Also volume was higher on up days last week.
There are indications that SPX will break above the box most likely on Monday, but we should not lose sight of the fact that the failure to break above the top of the box gives confirmation to another existing pattern on the chart: a bearish flag.
DIA / DJI/ YM/ DJT
The Dow Jones Industrials along with DJT and IWM led the market higher and lower during 2022. Last Friday it managed - just like the DJT and IWM - to make a solid upward breakout of the Noise Box consolidation, did so on high volume, amid a 700 point rally, which also allowed it to close above the 20, 50, 100 and 200DMA. All of this indicates that this will most likely be the way forward for the SPX.
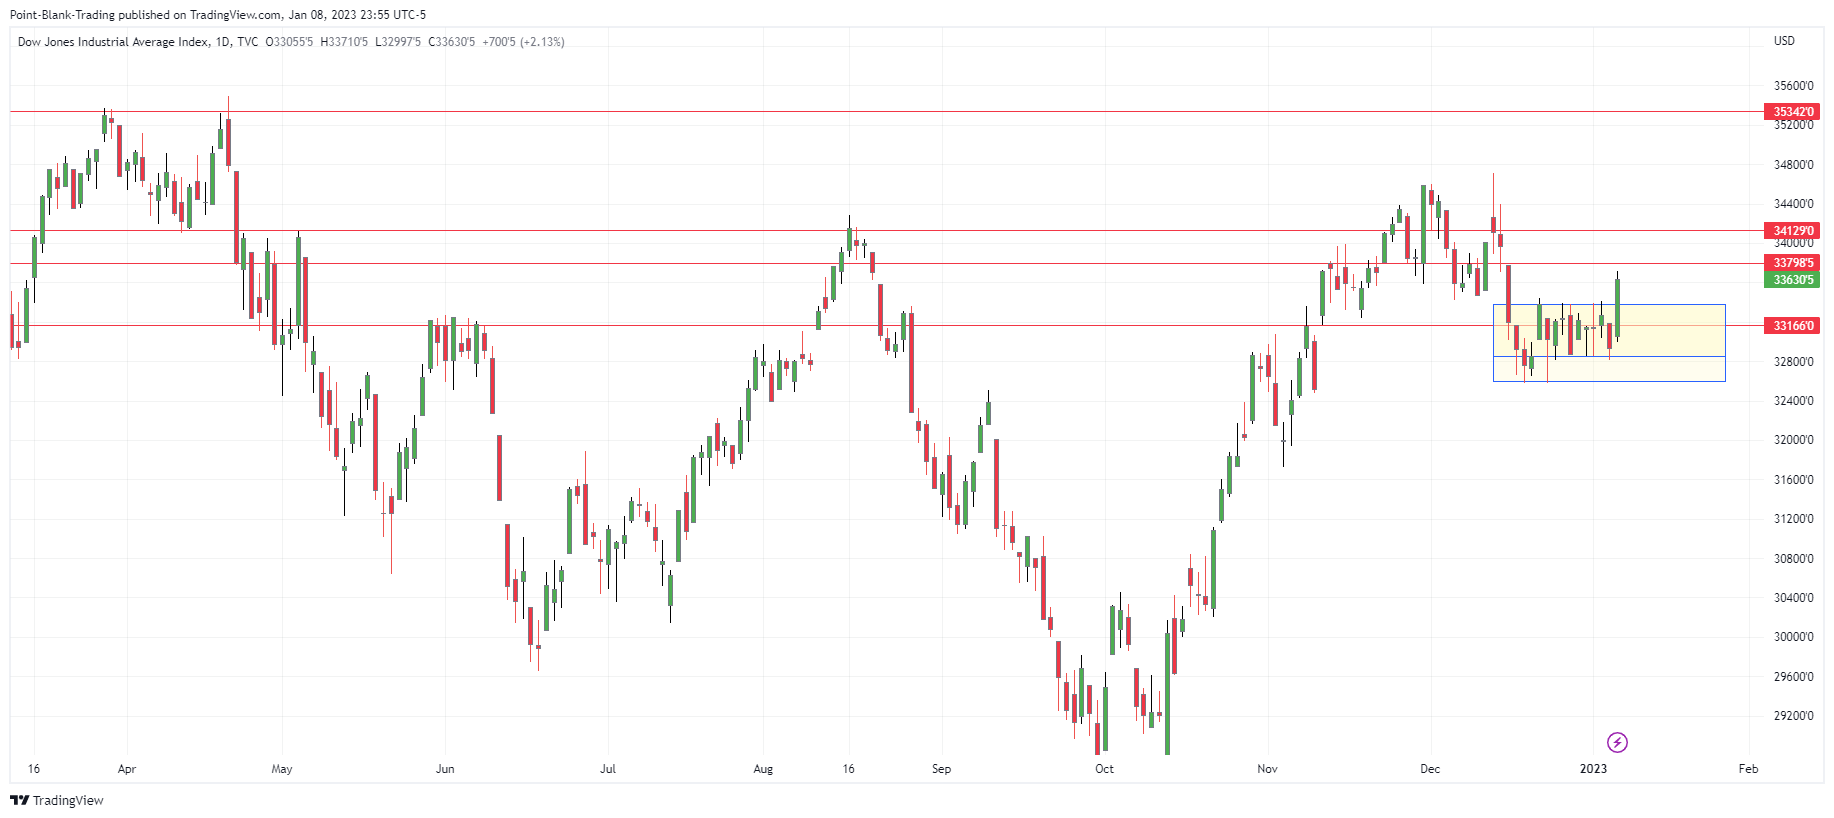
DJT, meanwhile, made an excellent breakout and closed above 20 and 100DMA. It closed right at its 50DMA. Bullish action from a leading indicator. DJT will have to surpass the conjunction of 50DMA and 200DMA next week, in order to validate more upward moves.

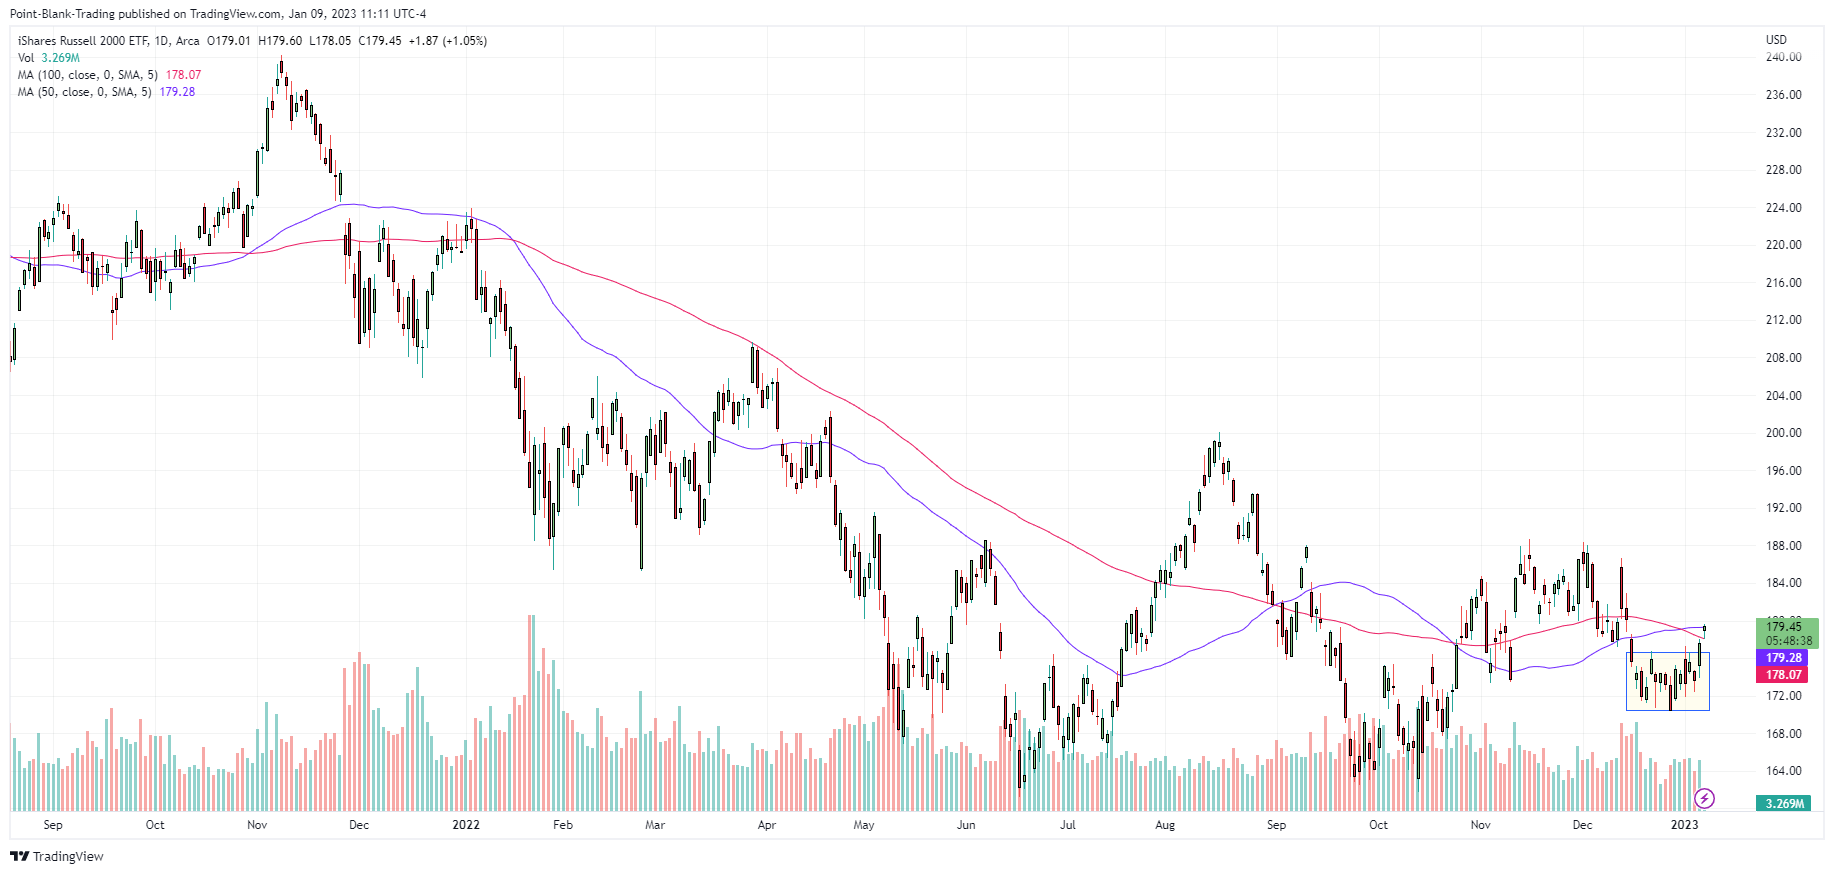
IWM / RUT / RTY
The IWM breakout was less impressive, lacked the high volume and only exceeded the 20DMA. It is still a bit behind DJI.
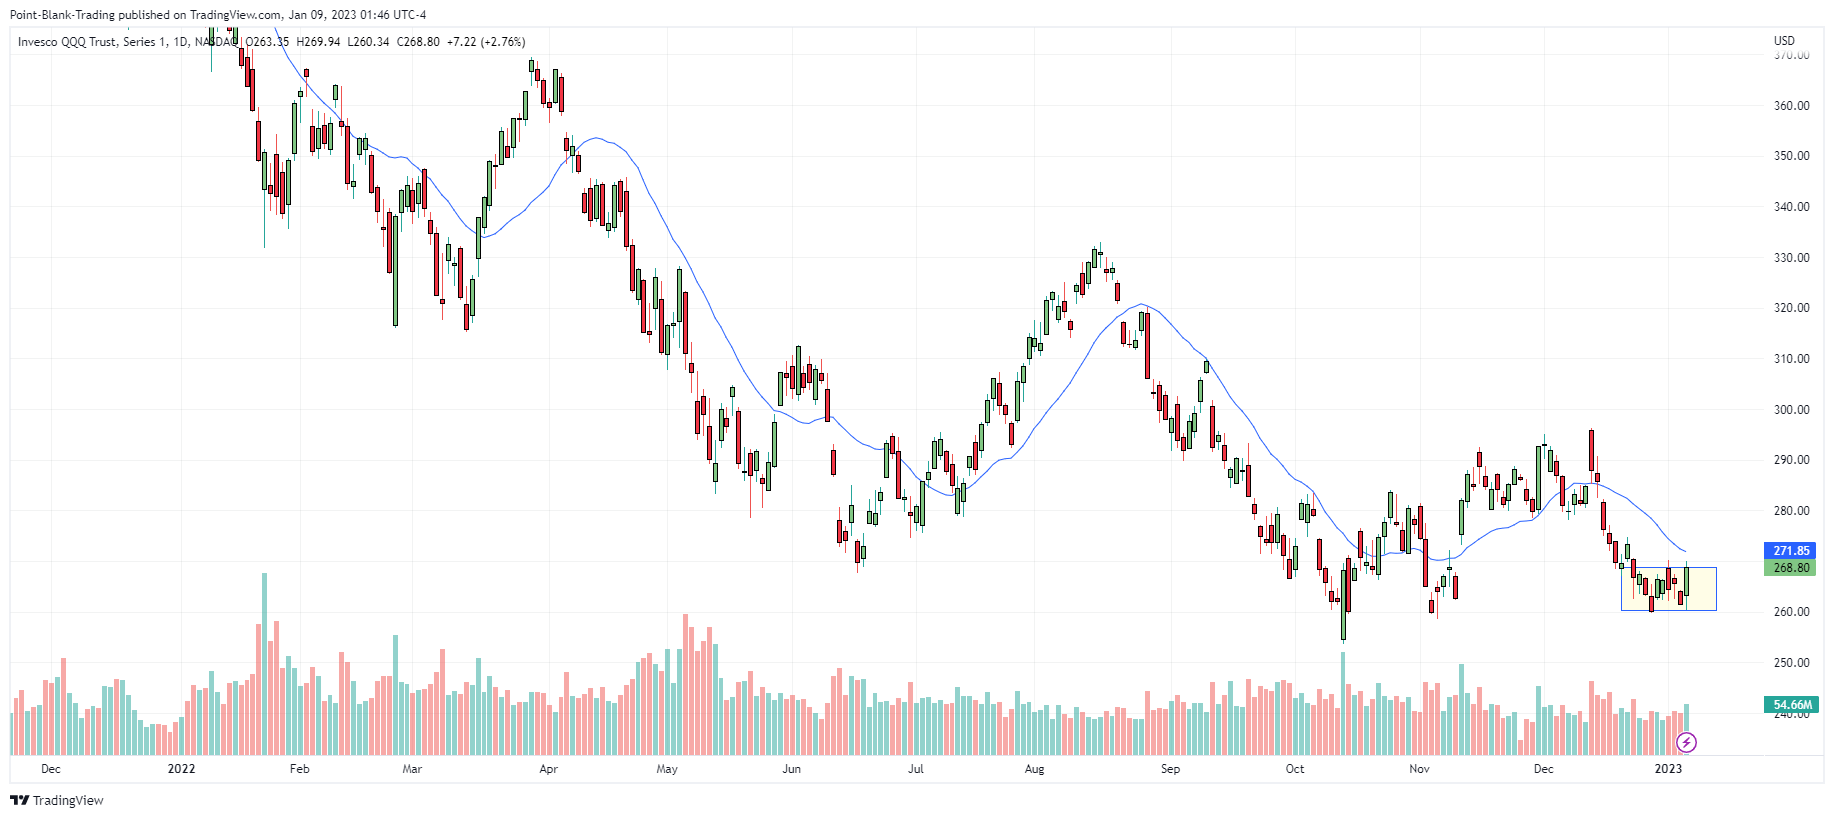
QQQ / NDX / NQ / IXIC
The Technology Sector which has taken quite a few hits during this bear market is the most laggard of the major indices. It is still inside the Noise Box and has not been able to overcome any of its MAs. It did however have a +2.76% rally on higher volume. A follow up rally is expected to allow it to break out of the Noise Box and break above at least the 20DMA.
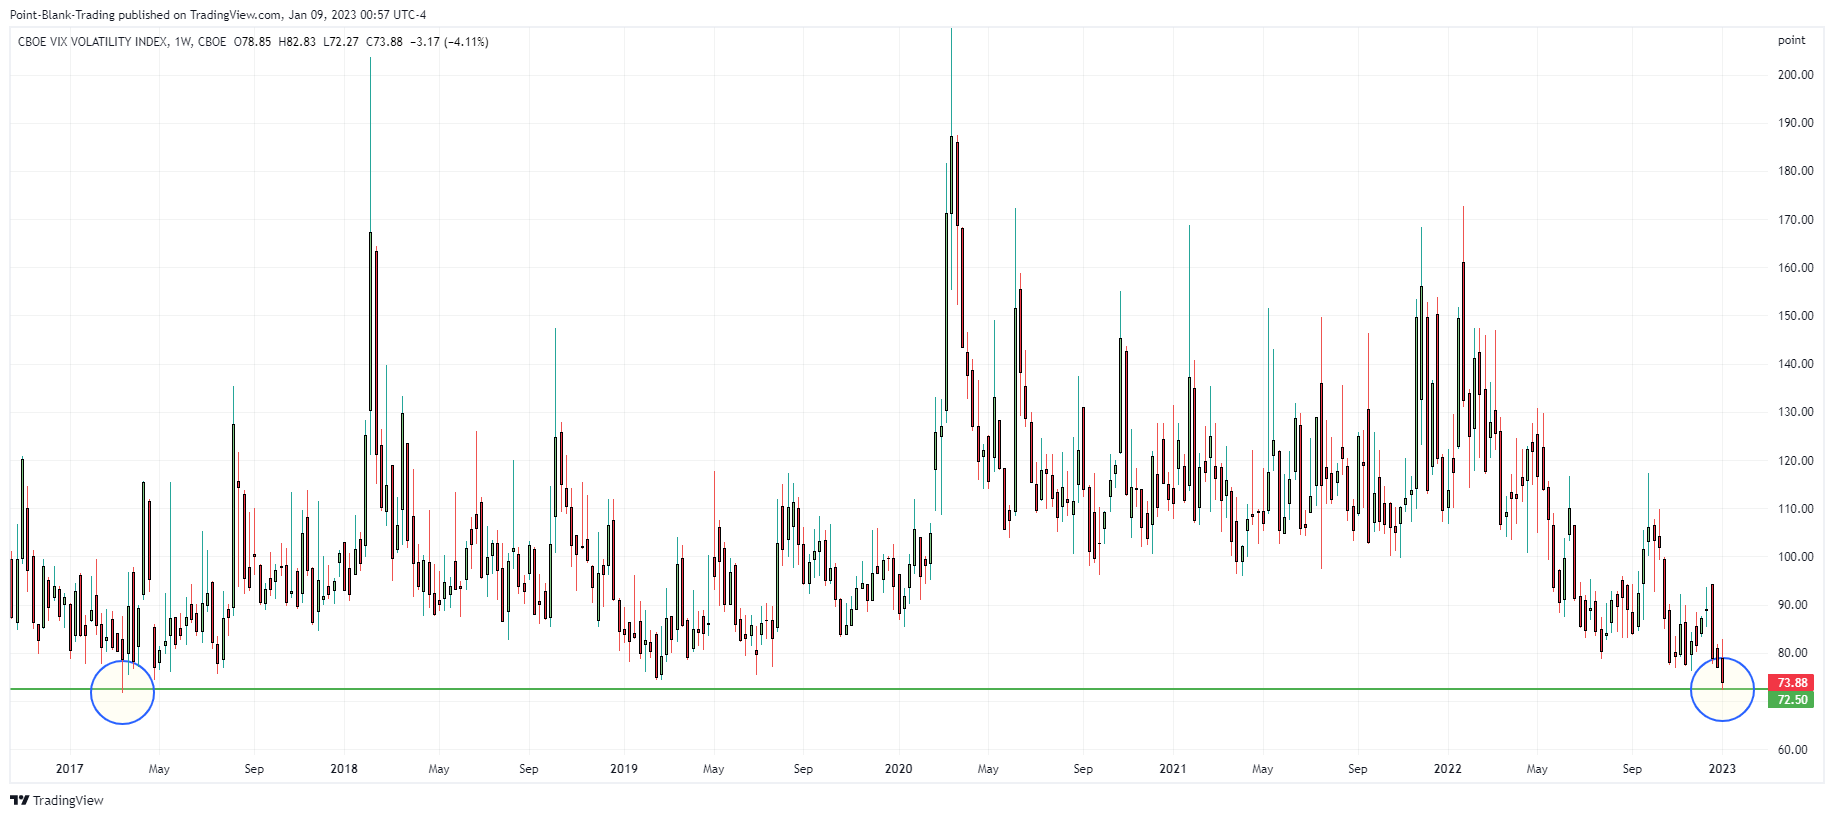
VIX
VIX continues to be trapped in a strong downtrend, it is below all of its moving averages. Its latest breakout attempt has been stopped 6 times by its 50DMA. The only thing bullish on VIX is that its 20DMA is curling upwards.

VVIX
Like VIX, it remains trapped in a strong downtrend. Last Friday it broke support and touched 72.5, price which it has not seen since March 2017. For VIX to have any hope of a bounce it is to expect a prior resurrection of VVIX
CLASSIC INDICATORS
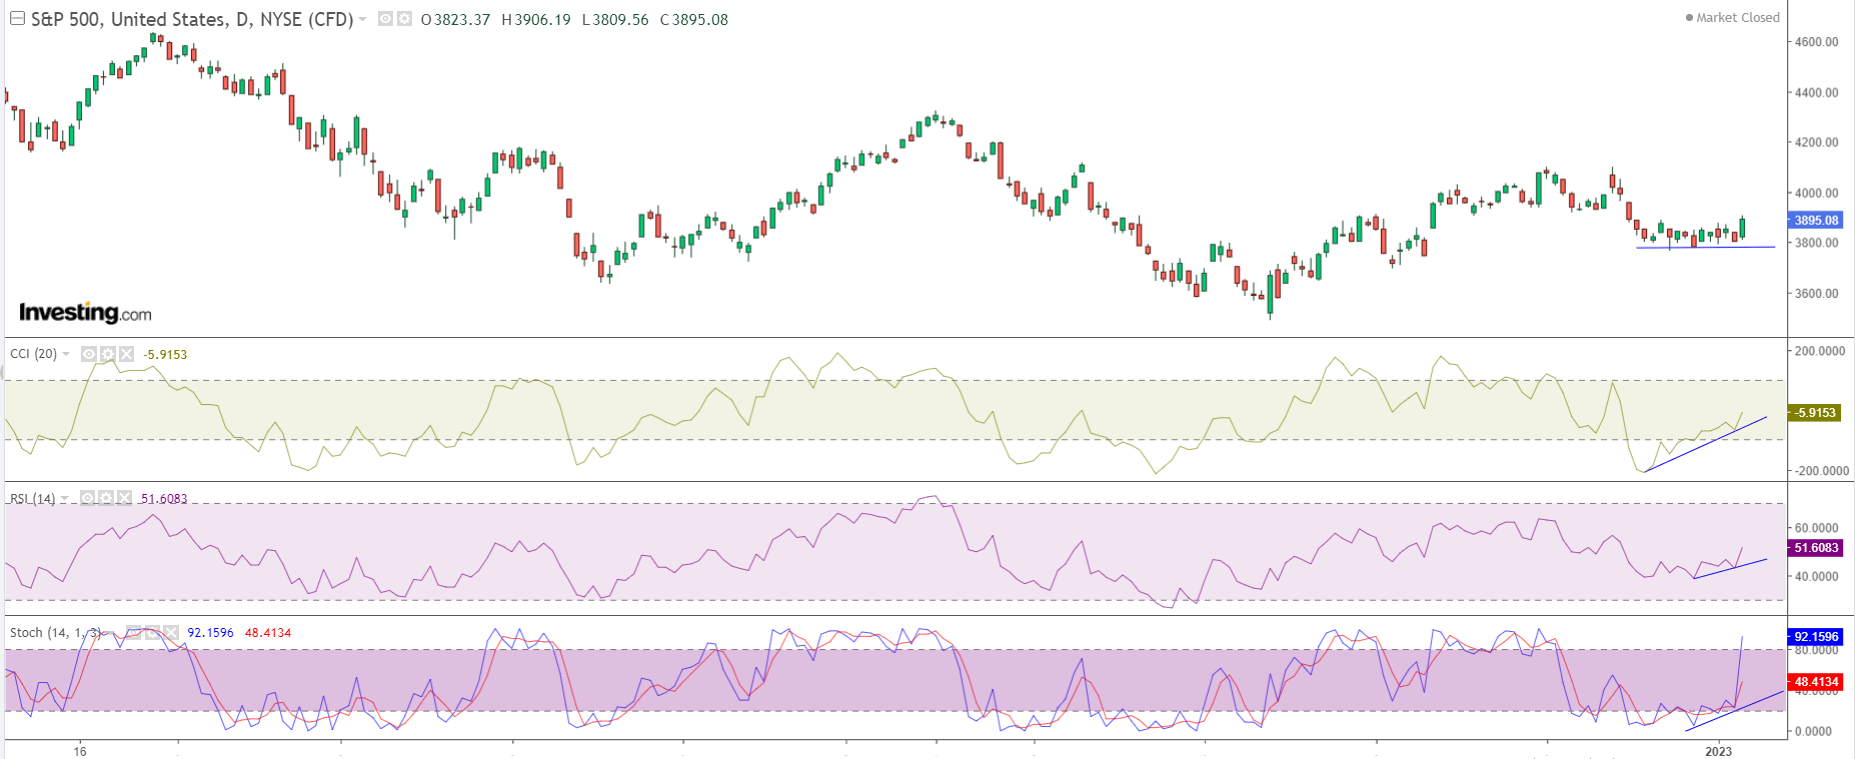
CCI Generated a buy signal on December 29th, has positive divergence and is not overbought.
RSI Crossed above 50 last Friday, has positive divergence and is not overbought.
Stochastics Generated a buy signal on December 29th, reconfirmed on January 4th, has positive divergence and entered overbought territory on Friday.
MACD generated a buy signal last Friday, it is still below 0.
ROC crossed above 0 on Friday, shows positive divergence and is not in overbought territory.
Williams %R generated a buy signal on December 29th, has positive divergence and entered overbought territory on Friday.
In general, the classic indicators look positive and portend more bullish moves in the coming days. Their positive and negative divergences have been early indicators during the bear market last year.
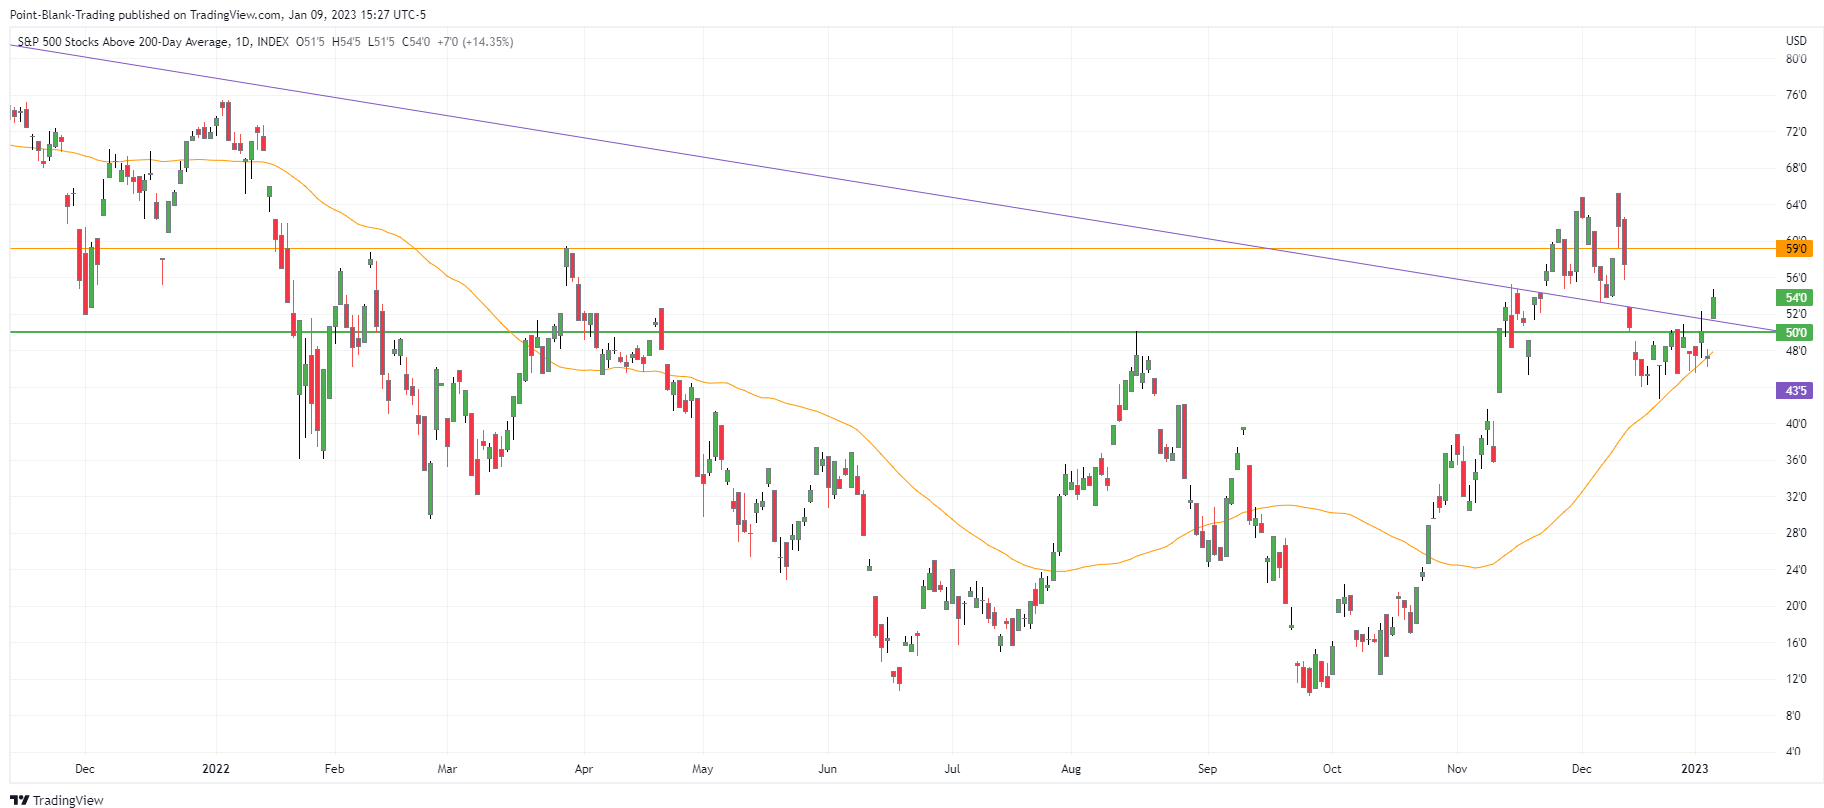
BREADTH INDICATORS
The SPX stocks above 200DMA Index found support at its 50DMA since December 22nd. With Friday's rally it managed to rise above the critical 50% level and also above 20DMA. It’s also back above the April 2021 trend line. It supports the idea of the follow up rally this week.
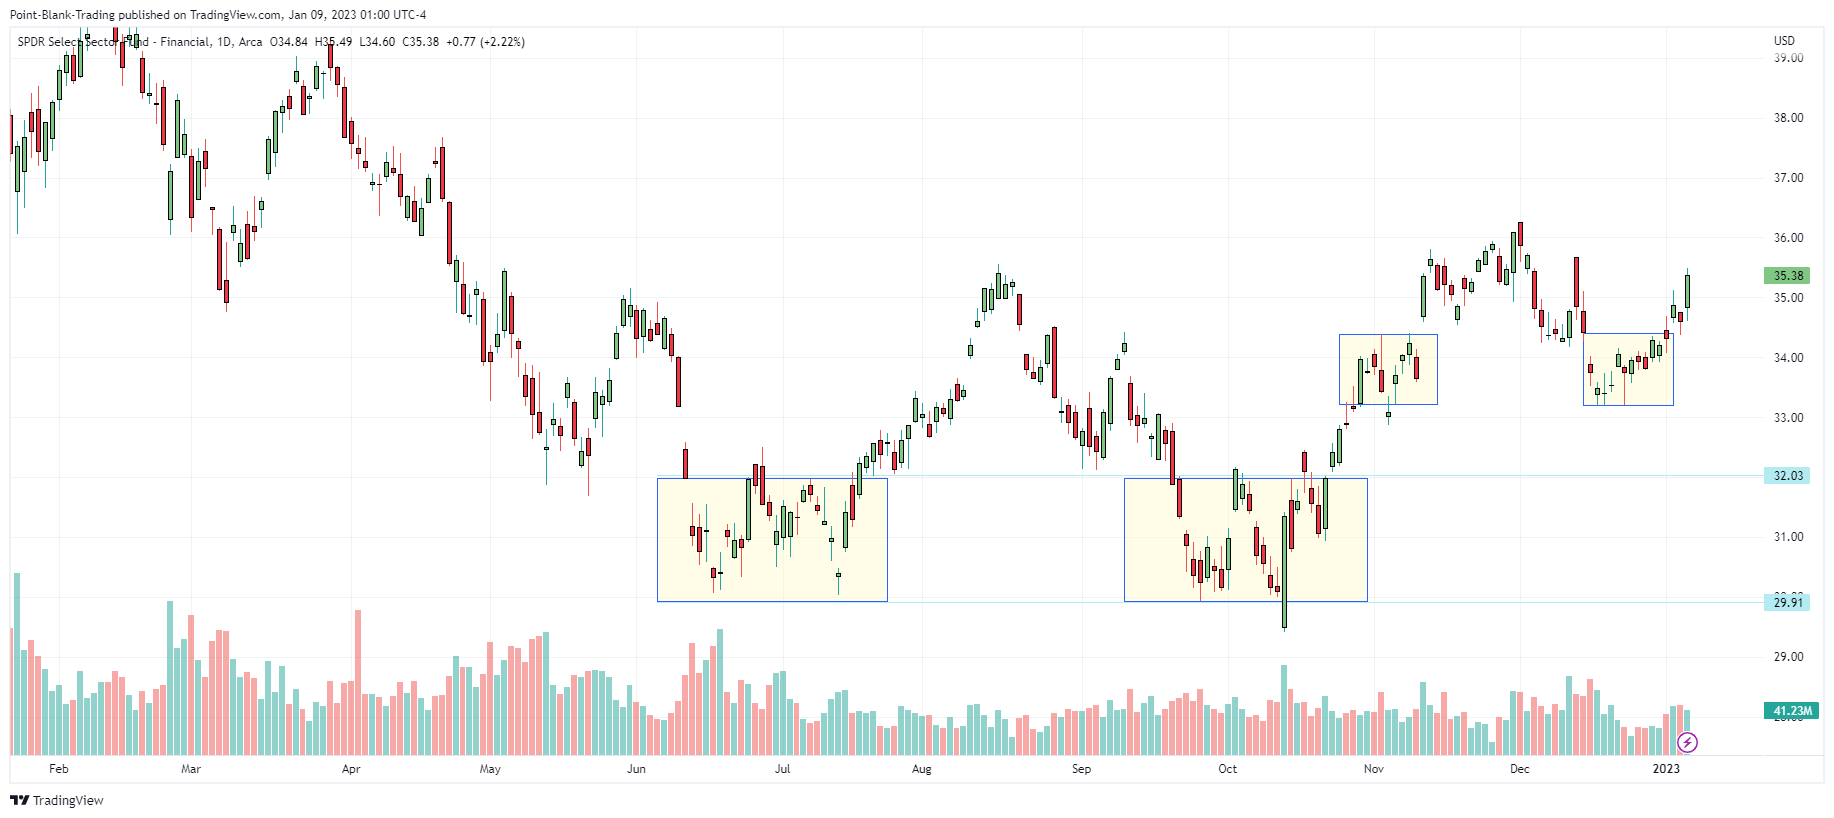
XLF
A sector that normally leads upward swings is the financial sector which in the last market bounces has rather lagged behind,but this time it appears as a bellwether, having produced a Noise Box of shorter duration - only 6 days - which it broke to the upside on Wednesday last week, surpassing the 50DMA at the same time.. It is now above all of its moving averages and closed the week with a bullish candle. Volume has not been extraordinarily high, but decent. Singularly, this move comes just before the banks' earnings reporting season begins next Friday and all of the following week. Commercial banks are supposed to do well in a high interest rate environment.
GAMMA/GEX
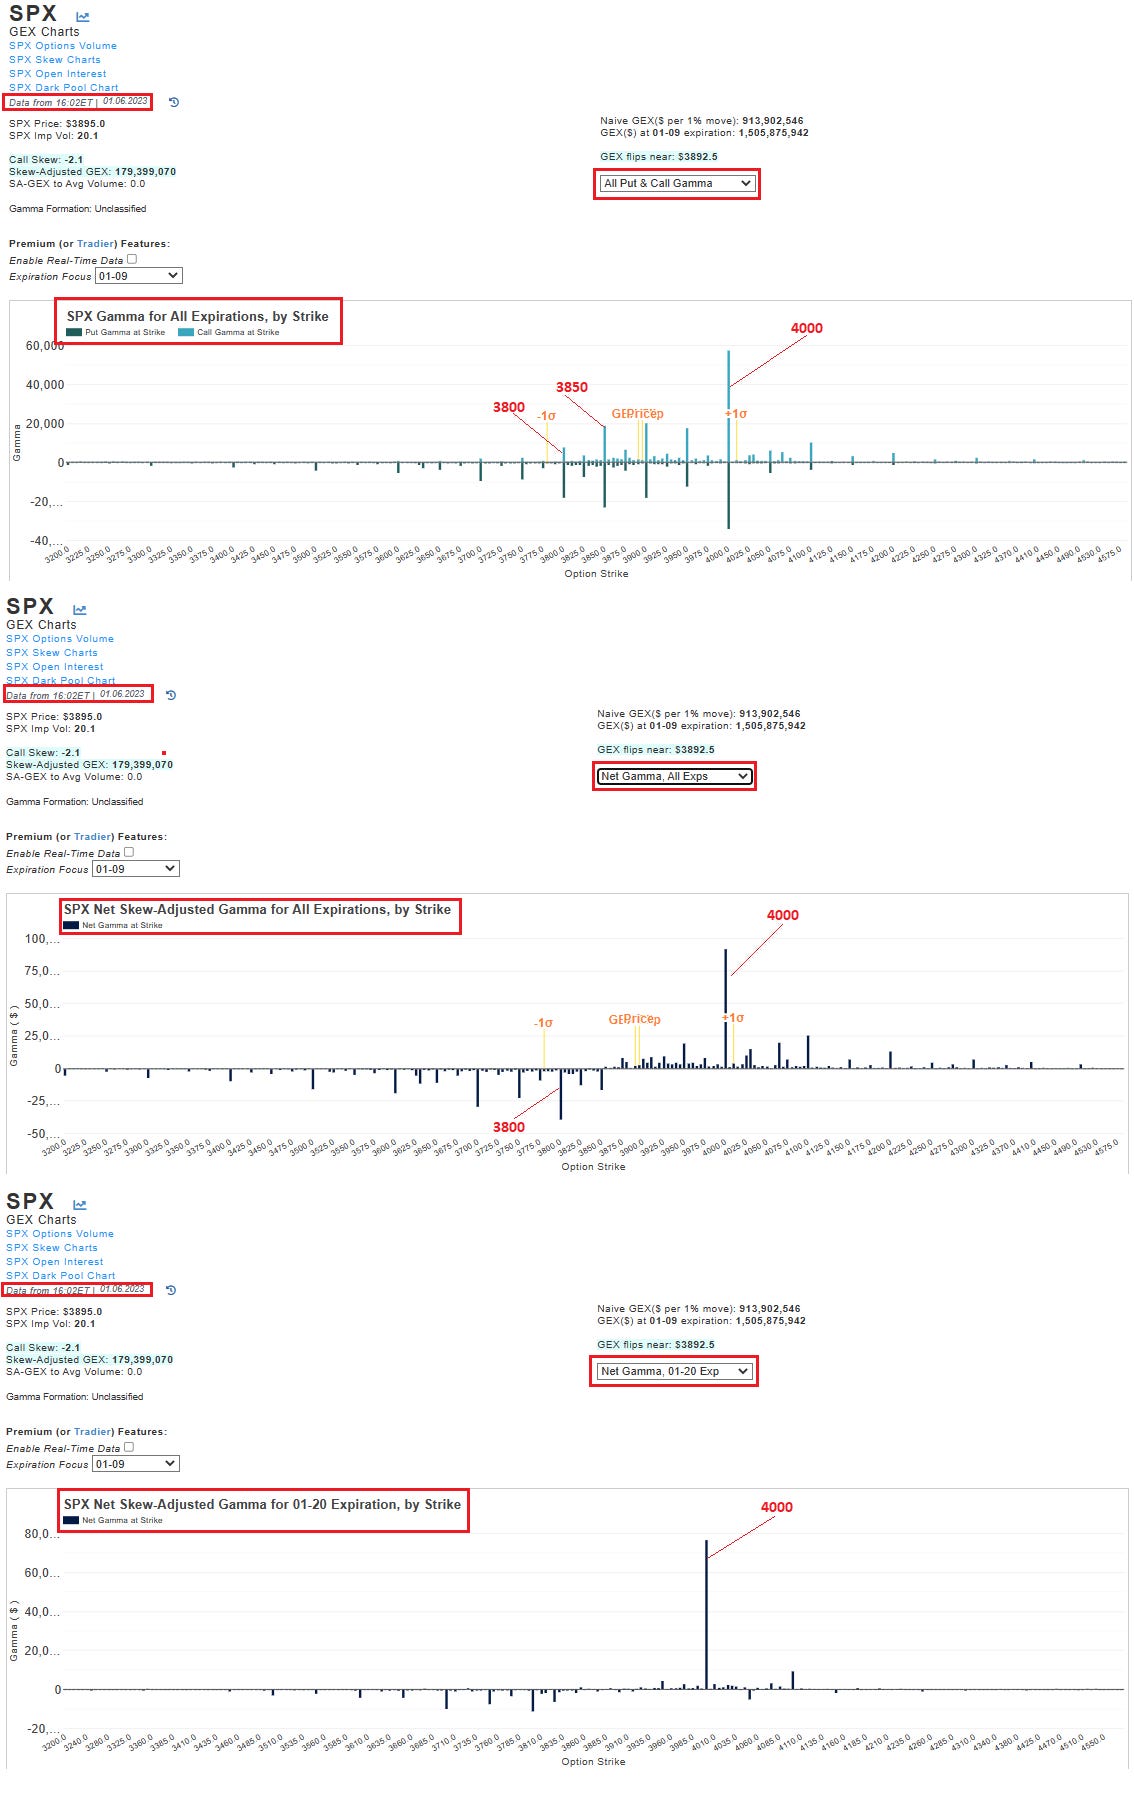
Examining the charts of the All Put & All Call Gamma for All Expirations, the Net Skew-Adjusted Gamma for all expirations and the Net Skew-Adjusted Gamma for the monthly expiration we note that although there is still a good amount of Open Interest below 3900, the greatest concentration is at 4000 which is again the focus of traders' attention, although not in the immediate term but the great concentration is on the January 20 monthly expiration. This accumulation is now a call wall, but could become a magnet and end up dragging the SPX to higher ground.
DXY
Not surprisingly, it was also caught in its own Noise Box. The current correlation of the dollar index and the SPX is quite high. Our readers know that we announced the dollar correction from 112.50 and that our we were expecting a Mean Reversion. The mean of the Regression Channel (the blue line) was at that time at 102.5, and it’s currently at 102.9. The channel mean has been an important support in the past, but if lost the next target would be at 100.3. A SPX rally would be almost conditioned on the mean not acting as support. We expect DXY to remain weak for the following days.

OUTLOOK
Market action this first week of the year has been a little rocky, but ended positive. You can find many statistics about what the market will do based in a positive first week, or a positive Santa Claus rally, but we are not out of the woods yet. All major indices, and leading stocks printed ugly monthly bearish engulfing candles.
In the immediate term everything points to an upward move in the markets this week. As we posted on our Twitter account we are expecting the market to open and close higher on Monday. However, we have Powell's speech this coming Tuesday. It will be difficult for Powell not to maintain his anti-inflation warrior tone, although perhaps as some expect, Powell will moderate the tone especially after the contraction of the ISM numbers that forecast a recession around the corner.
So far JP has shown that he does not want the stock market to go higher and every chance he gets he throws a bucket of water on it. We believe the market is prepared for this lack of love, and if Powell talks tough the chances are that after a dip the market will recover and go on its way to retest its resistance levels once again.
CPI figures will be released on Thursday. The general consensus is that softer numbers will show a pullback in inflation. A bad surprise could be very negative for the market. But lower numbers could be a tailwind for the markets.
Perhaps more important than Powell and CPI is the earnings season that starts this week. It will reveal whether a soft landing is still a possibility. Many companies have cut their earnings expectations, so delivering some "surprise" and beating consensus may not be such a difficult task.
CONCLUSIONS
We are expecting the market to open and close higher on Monday. It is very important for the markets to break the bear flag pattern present on their charts. For all major indexes that means going up and staying above Friday's high. If that is achieved the DJI should look to reach 34335, SPX 4000, QQQ 282, and IWM 183.
The break below the Noise Box will be followed for at least one or two days of big down moves.
Market action this first week of the year has been a little rocky, but ended positive. You can find many statistics about what the market will do based in a positive first week, or a positive Santa Claus rally, but we are not out of the woods yet. All major indices, and leading stocks printed ugly monthly bearish engulfing candles.
We are still in a bear market. Bear market rallies can be strong and persuasive, Trade’m, but don’t Trust’m. Be always cautious
Have a great week and productive trading!!
which also you mentioned in your twitter? is there any website or tradingview indicator? would like to try it. Thanks.
Thank you!