

Ready for a bounce?
Ready for a bounce?
Market Commentary for the week from 02/26/23 to 03/03/23 • Issue No. 25 • Analysis and Outlook elaborated by @PointBlank_Algo • GEX charts and data by @TradeVolatility

REVIEW
SPX encountered strong resistance near 4200 and its failure to overtake it after many days of struggle gave the bears motivation to push it lower generating a pullback if you will healthy because of how over extended the market was. The pullback, as we expected a couple of weeks ago, led the market to retest its breakout zones, whether they were lines or moving averages.
On weekly charts it is clear that the three-week decline has been generated on declining volume, not exactly what you would expect to see when the bears are touting an impending crash or a visit from the October lows.
Market breadth has deteriorated both the put/call ratios and the cumulative ADV/DEC line,but that is to be expected when the market declines.
The percentage of SPX shares above 20DMA, which is the most sensitive of the indices tracking the 50DMA and 200DMA, has dropped to near extreme levels and closed at support last Friday, but the 200DMA managed to close at 57.5%, a level still considered positive.
Thursday's and Friday's reversals plus the volumes seen in the price action leads us to expect a bounce from Friday's levels or a little lower. The strength of the bounce will tell us whether the retest was successful or not.
Let's see what the charts say.
ANALYSIS
SPX / SPY / ES
Since breaking below 4074, the bottom of our Noise Box, the SPX has not stopped falling. We said that the violation of that level would be an excellent trading opportunity, and it has been as the index has lost more than 100 points in a few days. managing however to minimize losses on Wednesday and Thursday when it bounced off its 50DMA, and even more so on Friday when after violating that 50DMA support it managed to bounce off 200DMA. This is a super critical level for the SPX.
Right now SPX is in what we have called the Convergence Zone where the downtrend line that ruled the entire fall of 2022 and part of 2023, also the uptrend line linking the December lows, plus 50, 100 and 200 Moving Averages are meeting. In fact, last Friday's candlestick has for floor the 200DMA and for ceiling the 50DMA, it is in the "pinch".
We think that SPX could go down a little more near 3900, but that there would be an important rebound of several days considering that this is the third week of declines of the SPX with decreasing volume, and that it is in the convergence zone of all types of supports. The loss of these supports would take us to the 3775 area, but this does not seem to be a likely scenario right now.
SPY managed to regain ground on Friday and close with a green candle on higher volume.
Stochastics, ROC and Williams %R show positive divergence on daily charts. Stochastics, %R and CCI are in oversold territory.
So far the market has had a expectable retracement and retest of their breakout lines. The strength of the rebound that we expect to start Monday or Tuesday will indicate whether the retest was successful.
To consider SPX broken, it would have to break below the December lows in the 3800/3765 area.
Most of the SPX charts we have seen posted present an uptrend line linking the October lows to the December lows which was violated by SPX on Friday. However, according to our market map construction, SPX remains in the upward channel that began in October.


DIA / DJI/ YM/ DJT
Since November it has been in this wide sideways range between 34600 and 32600.
After leading the first part of the October rally, DJI is no longer the darling of the market. Its crossing below 50DMA precipitated it to the downside, managing to get some floor at 32815, which coincides with the 50-week average. On Friday it closed below 100DMA. It could visit the 32600 neighborhood before a meaningful bounce.
There are positive divergences with the Stochastics, ROC and William %R indicators.
DIA and DJI, the most extremely oversold indexes.

IWM / RUT / RTY
It bounced on Friday off its short term trend line and closed with a green candle on higher volume. It’s ready to bounce, we expect IWM to close positive on Monday and/or Tuesday with initial target of 192.

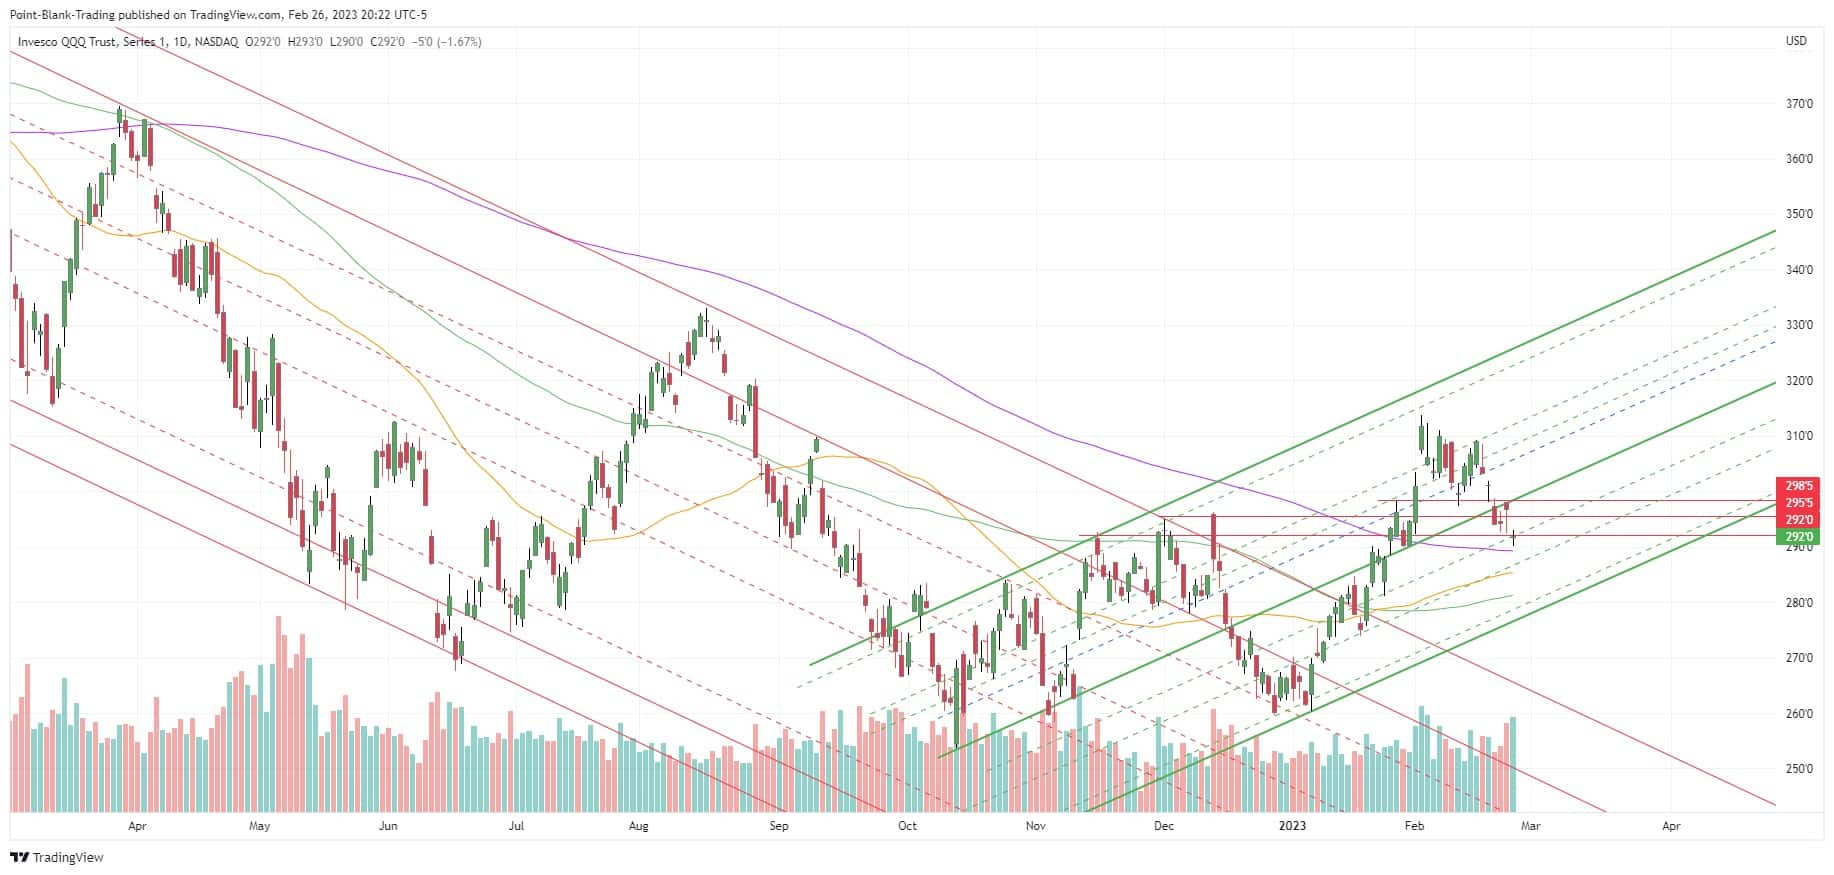
QQQ / NDX / NQ / IXIC
The Nasdaq Composite Index, ticker IXIC in Tradingview, pierced and closed slightly below 200DMA, however QQQ came close, but didn’t touch it. NDX bounced right back from there on Friday, closing with a doji and high voluem. We expect QQQ to begin a multi-day bounce on Monday or Tuesday.
VIX / VVIX
VIX after a two-day jump reversed and fell back below resistance. The 100DMA managed to contain its advance once again. It closed the week with a long wicks doji, perhaps indicating a return of the downtrend. Friday's daily candlestick is an inverted hammer that could be considered bullish, but it looks like it could move lower before trying to move higher again.
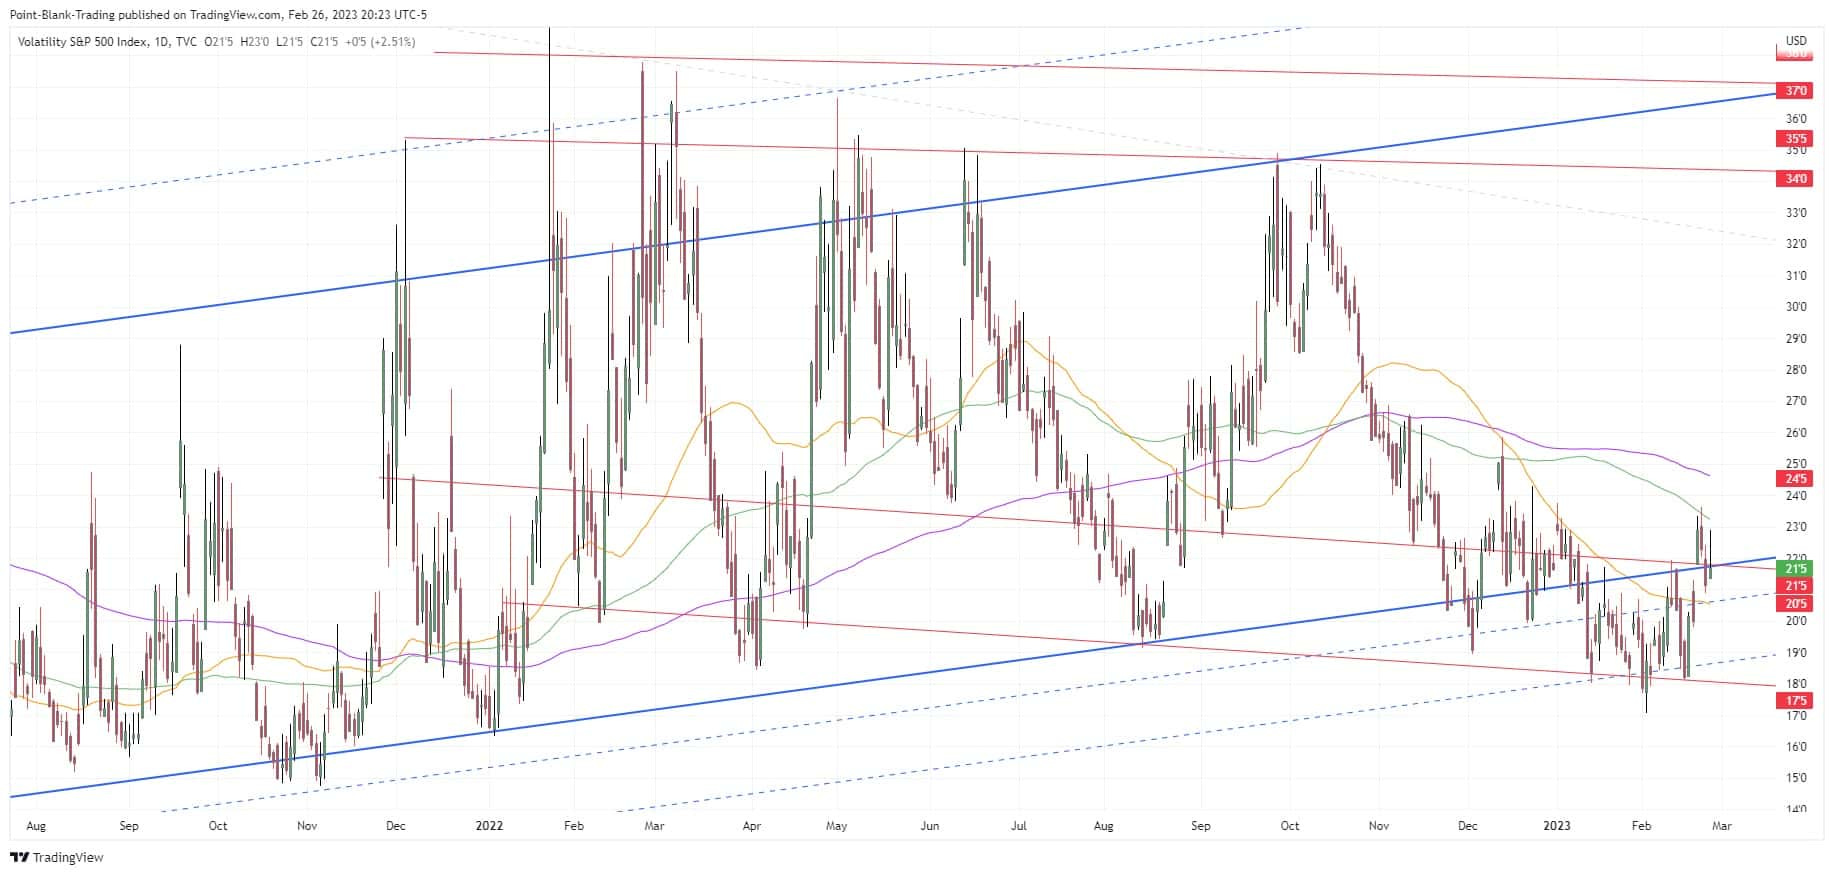
To see what VIX could do let's take a look at VVIX. After the strong advance it started on February 8, VVIX has pulled back and made a lower high. It closed back below the 200DMA. It did not accompany VIX in last week's rally attempt, it seems to continue in its strong downtrend.
But watch out, let's keep an eye on what could be an incipient upward channel in formation. It closed above an uptrend line that may offer support.
Unless VVIX breaks the dominant downtrend line, we expect it to remain in its downtrend.

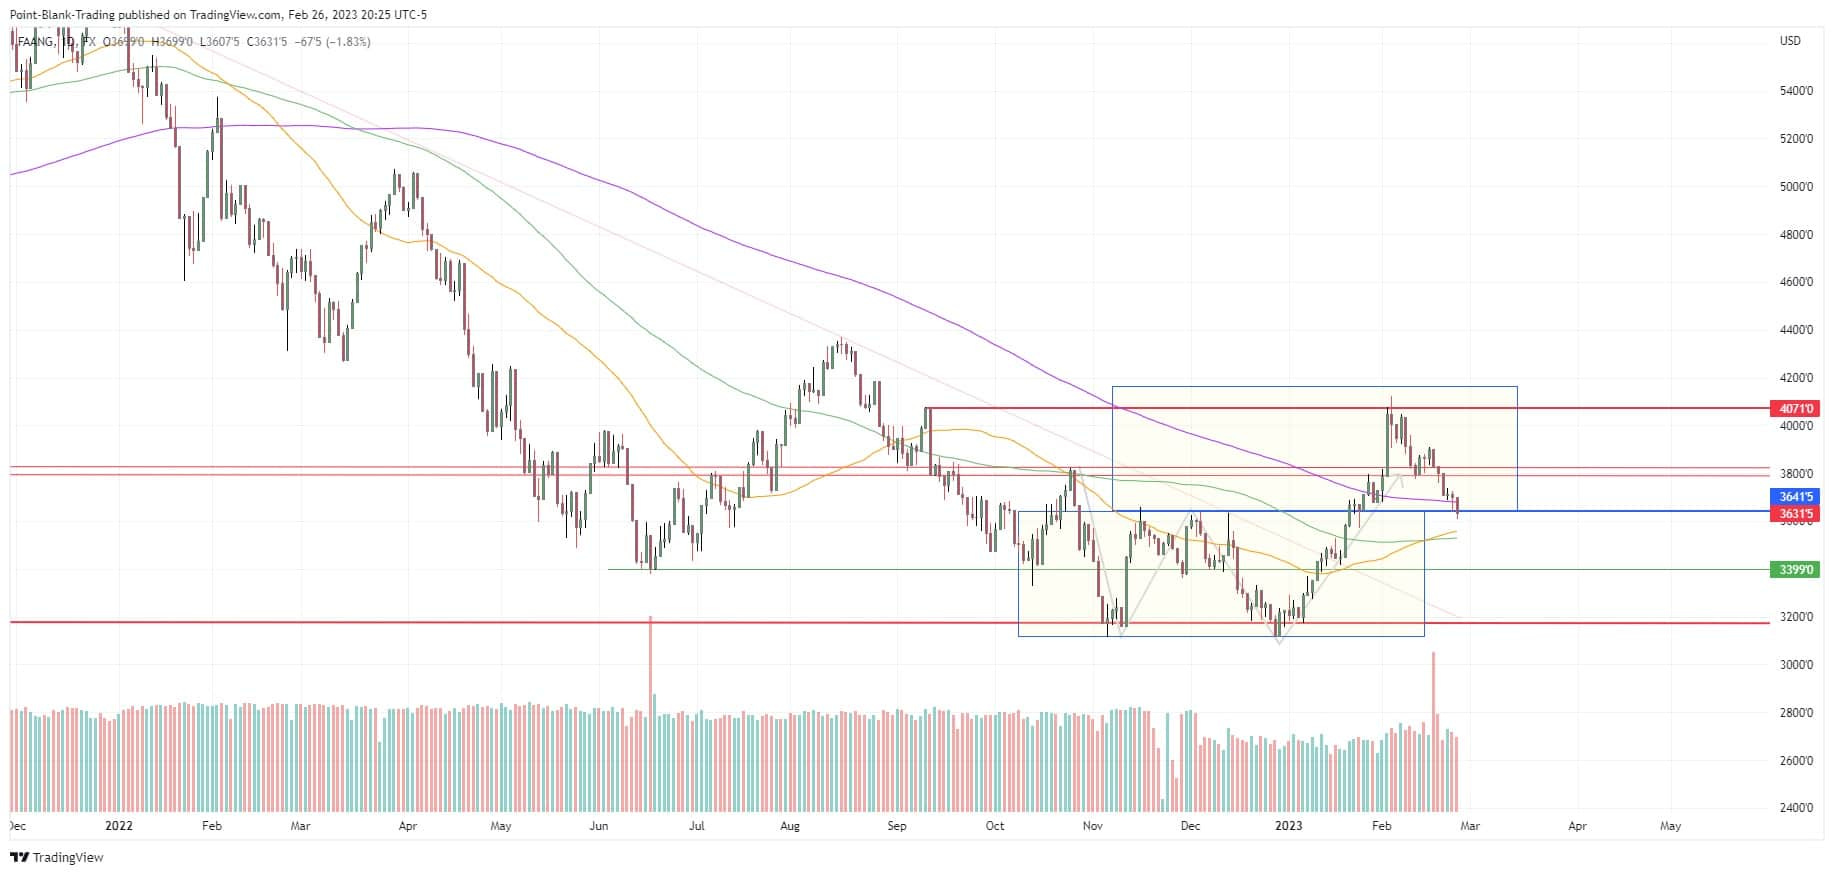
FAANG FXCM
After bouncing on Thursday from its 200DMA, it closed below it on Friday. It closed right at the breakout line of a double bottom pattern. It is important that it bounces on Monday and closes above the 200DMA. From the strength of the bounce we will know if this retest of the breakout line will be successful or if it will go to lower levels.
Expecting FAANG to bounce Monday or Tuesday.
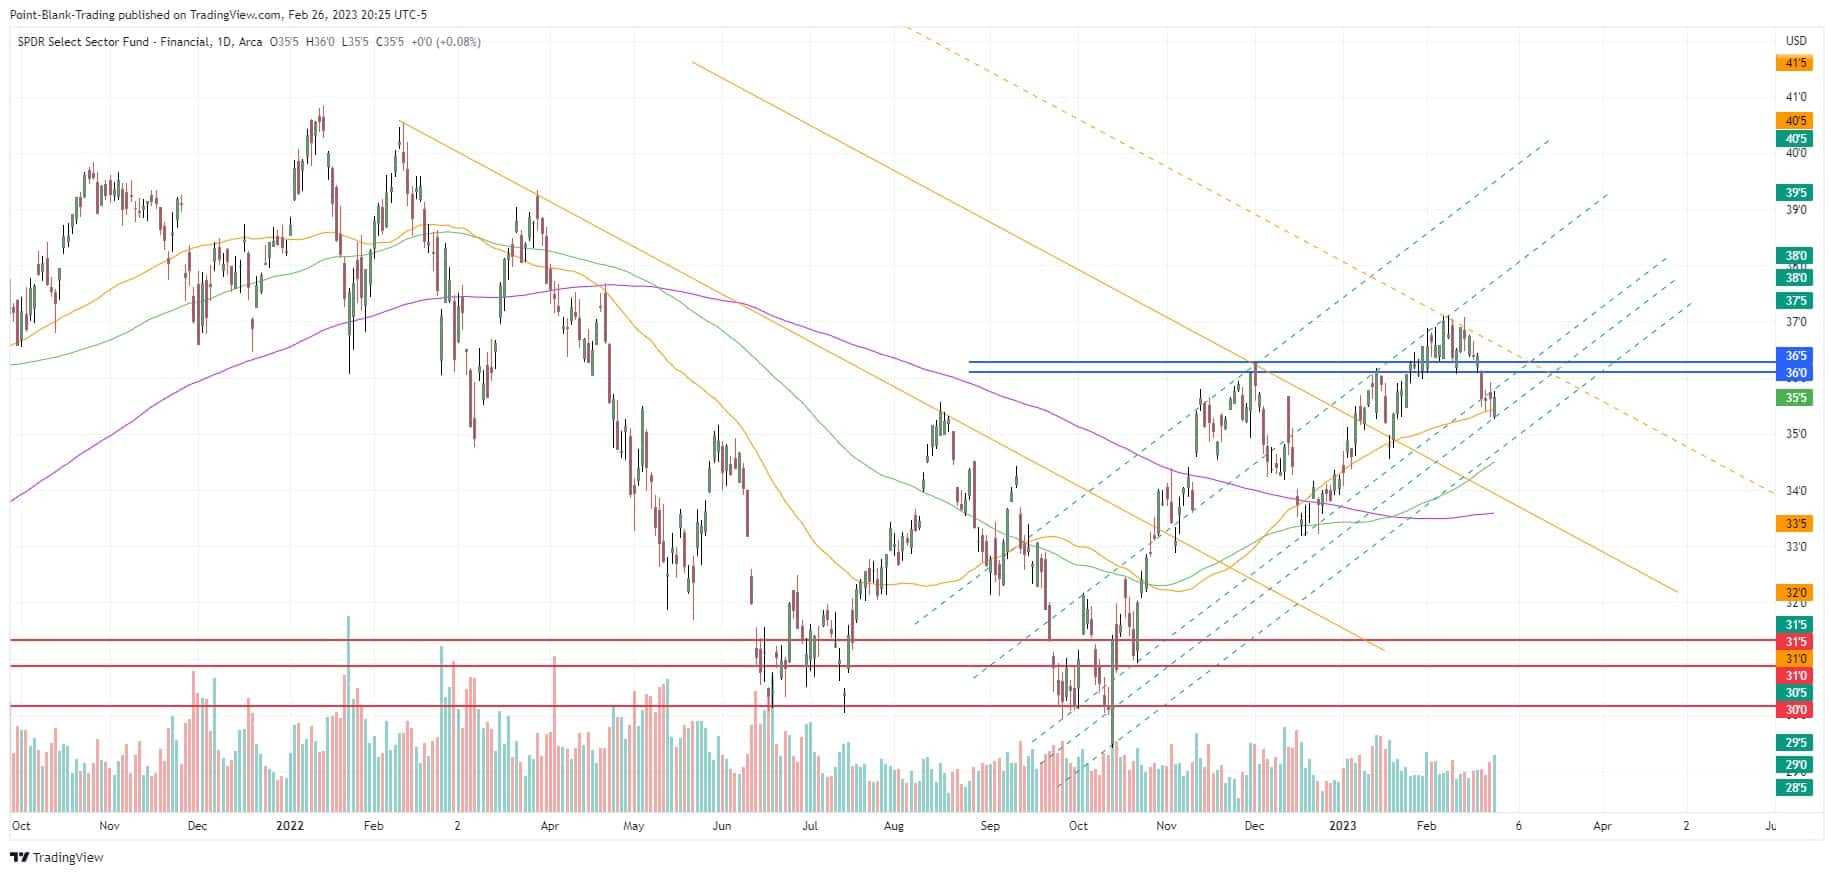
XLF
50DMA provided support to XLF once again, bouncing from there on Wednesday, Thursday and Friday. That recovery from Friday's losses led it to print a nice green candlestick on high volume.
The weekly chart clearly shows that 100WMA has served as support since January of this year, having risen with more volume on up weeks than on down weeks.
We expect the financial sector to begin a multi-day bounce on Monday or Tuesday.
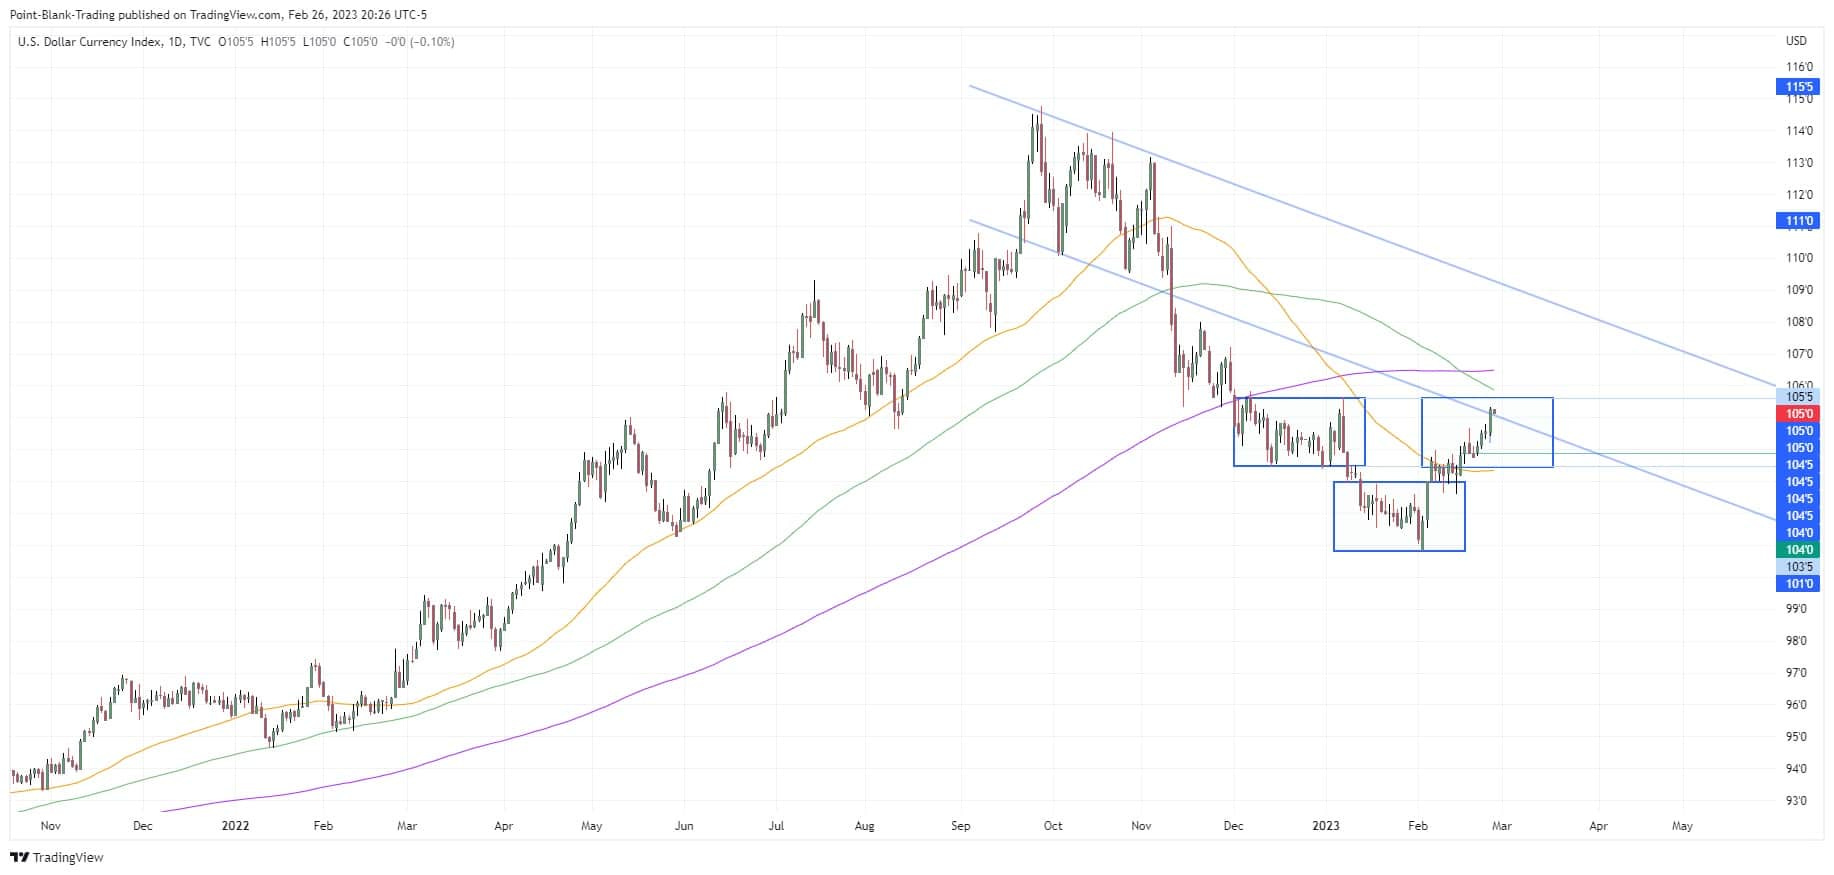
DXY
We did not expect DXY to cross above 104.5 this week, however on Friday it managed to do so quite energetically, closing near 50WMA which has been support/resistance in the past. In the 105.5 area it will find strong resistance, both from the aforementioned weekly average as well as horizontal resistance. We expect it to remain in a range (103.5-105.5) for the next days.
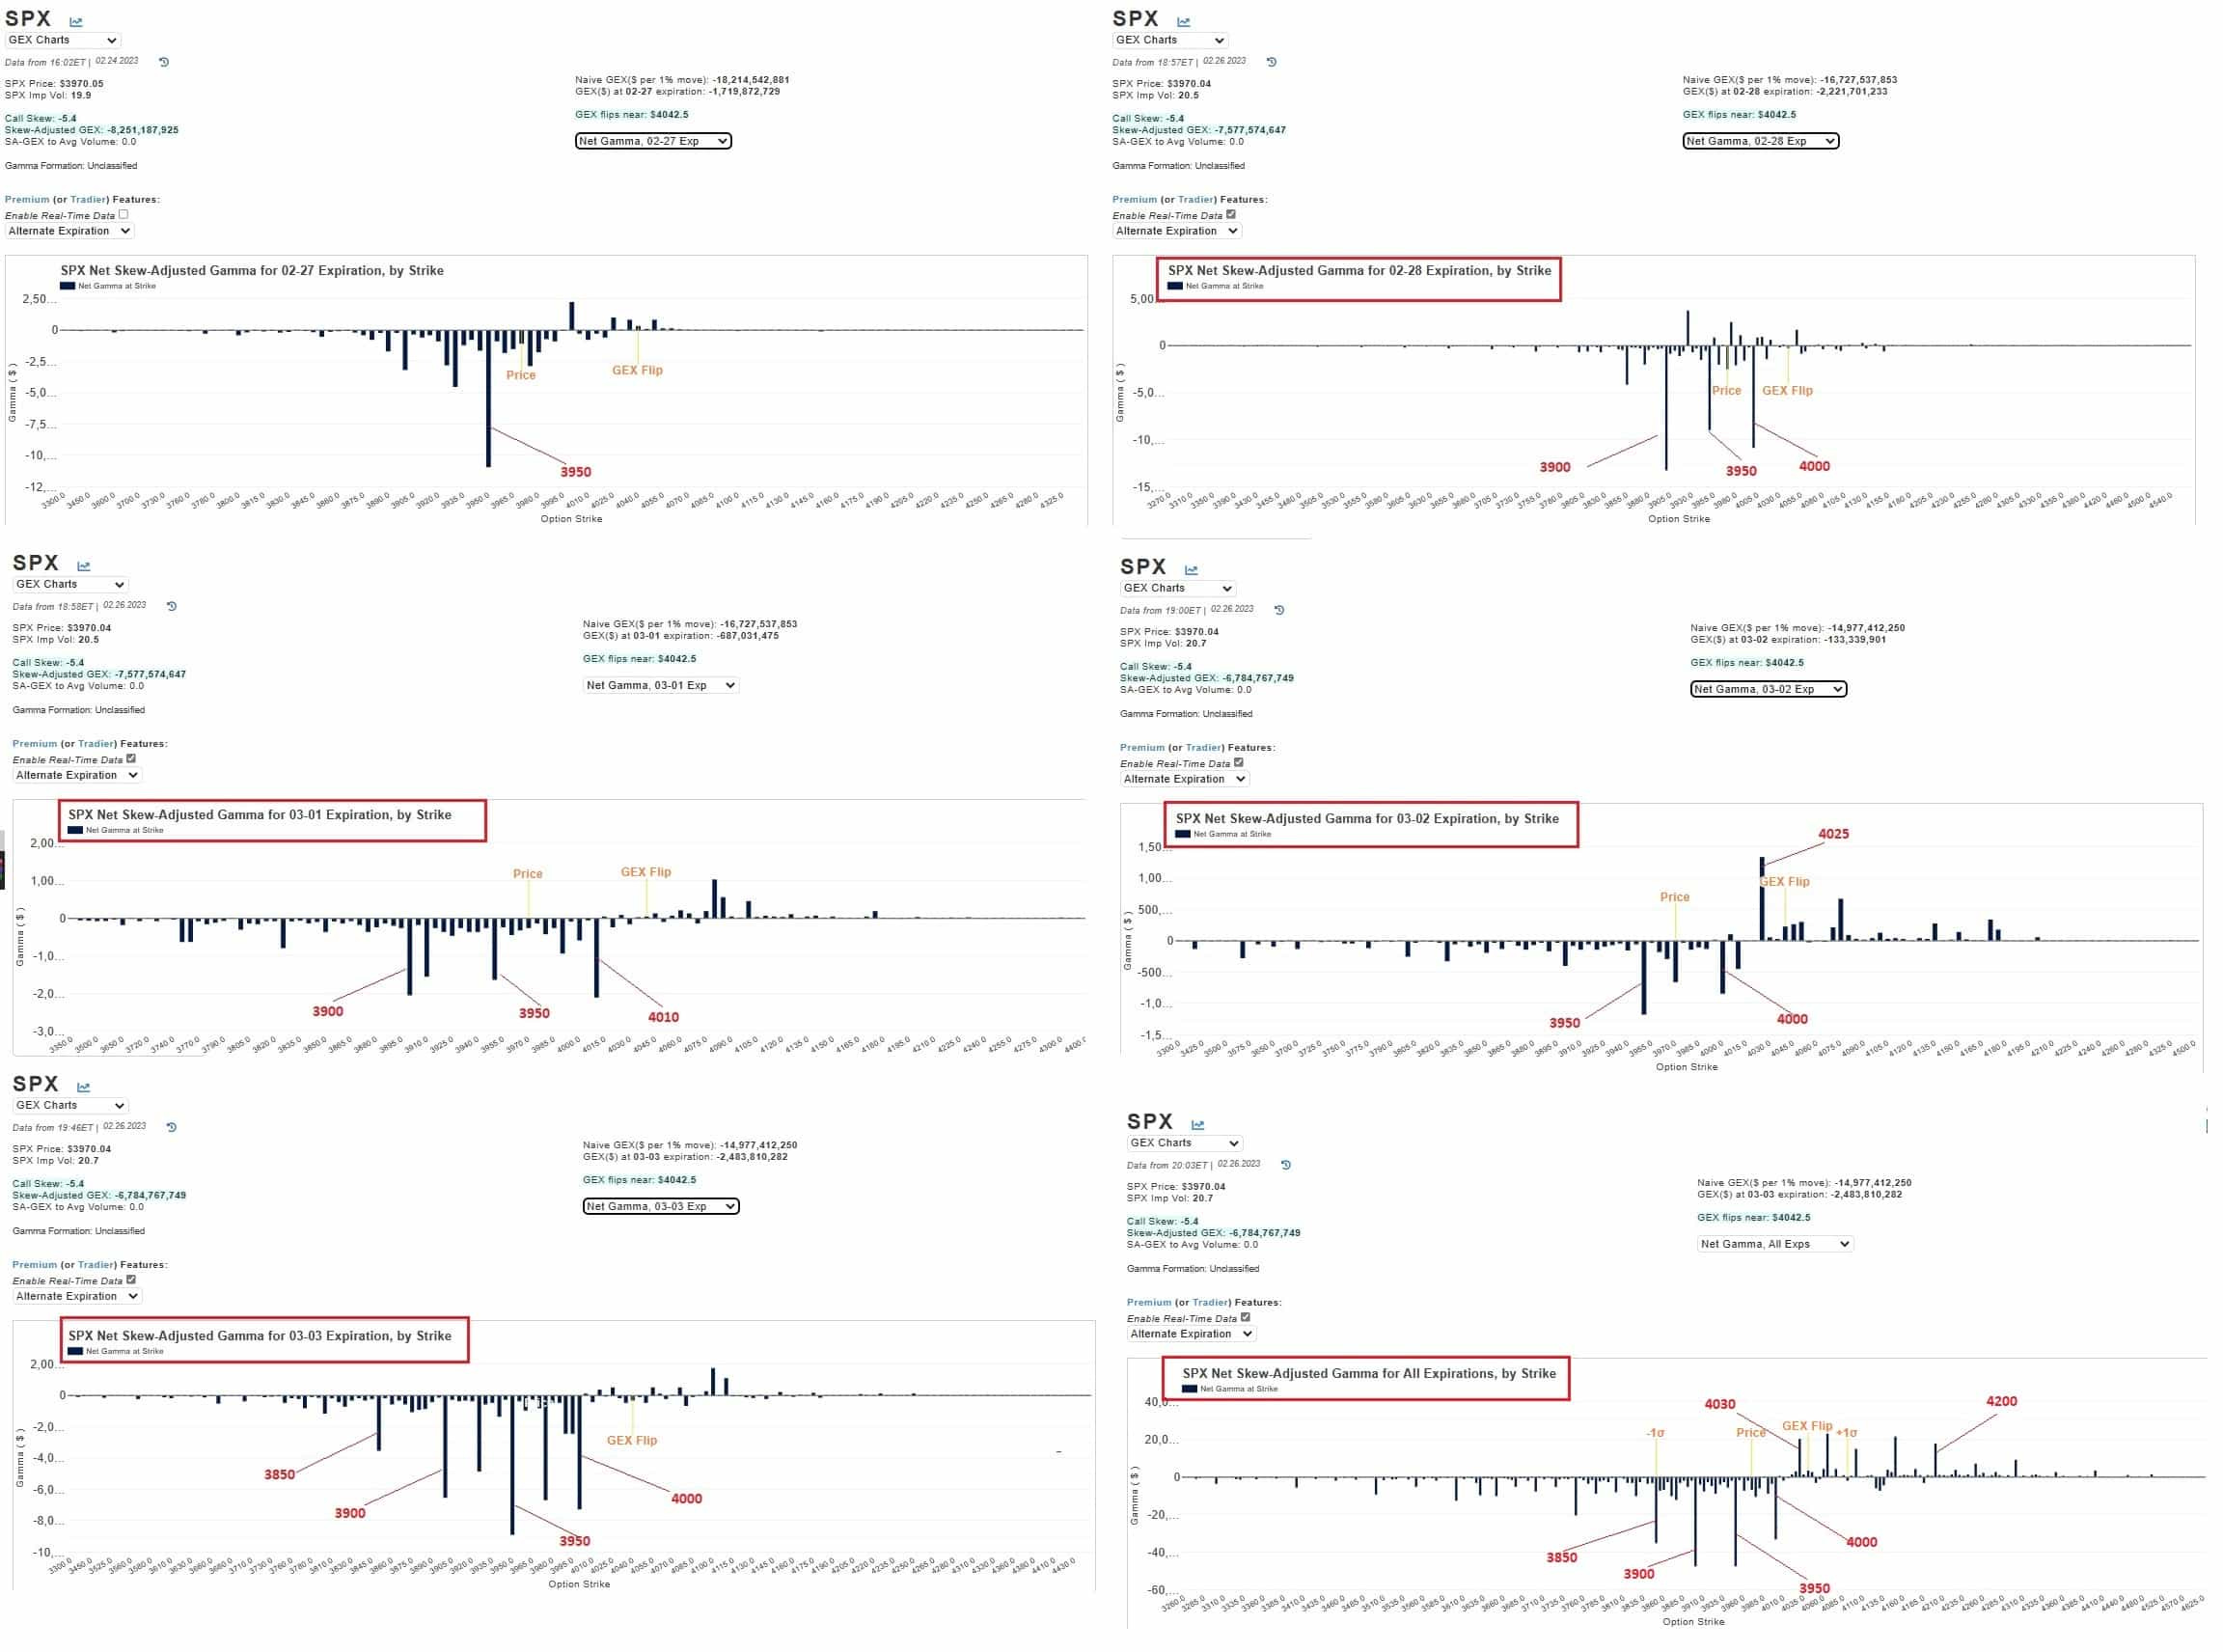
GAMMA/GEX
(Charts and data from @TradeVolatility)
The GEX structures of the week show mainly negative Gamma predominance and coincide in a range between 3900 and 4000-4010.
3850 and 4200 have some interest from traders, but the one that attracts them the most is 3950.
Tuesday's session has the highest risk $$ Gamma exposure, while Thursday's session has the lowest.
On the Net Gamma chart of all expirations 3900 and 3950 are vying for the top spot as the largest negative Gamma pile, followed by 3800 and 4000. On the minority positive side 4030, 4065, 4150 and 4200 are competing for the top spot as the largest positive Gamma stack.
GEX changes dynamically, so these Gamma topographies could change drastically as the market moves in one direction or the other.
TLOOK
As expected weeks ago, the market launched a typical retest of the breakout zones, either trend lines or moving averages.
This retracement brings respite to a market that looked overbought. The fact that it occurred on low volume has bullish implications.
We expect an initial bounce on Monday or Tuesday, which will push the market higher over the next few days. The strength (volume, range, expansion) of that bounce will indicate whether the retest was successful or not. We say Monday or Tuesday, because some indices had not fully reached the breakout or support zones in question and there could be a possibility of a visit and/or piercing of those areas before seeing a significant bounce.
We believe that the dollar will be in a range between 103.5/105.5 for the week and that the IWM as well as XLF and SMH will help the market to float as early as Monday.
Stay cautious because the market is not in a safe zone yet.
Trading is risky, prepare a plan before you act and then stick to the plan.
Have a happy and successful trading week.
Super analysis. Well detailed and comprehensive. We are happy to say that this is to the most part in line with out own analysis. Although I would not expect a bounce with strength to materialized before March. 27th and 28th are month end days and it is likely they will close red with Tuesday or Wednesday being a strong red day. Lets see how it progresses.