

SPX, BullMarket or BearMarket? • 4200, the Make-or-Brake level
SPX, BullMarket or BearMarket? • 4200, the Make-or-Brake level
October 24, 2023. Special bulletin elaborated by the Point-Blank Trading team

REVIEW
Last July 27th SPX opened higher with a gain of 31.5 points. Everything looked very bullish. In the first 5 minutes after the open it went up another 8 points to 4606 and then stalled. In less than half an hour a pullback began, which, after a failed bounce attempt from the 4585 level, accelerated from 1:00pm pushing the SPX 77 points lower from the morning high. That was a 1-day reversal with range and volume expansion that initiated a strong downtrend that persists after almost 3 months and as of last Friday has caused a loss of 400 points to the SPX.
In that interim SPX has had two important bounce attempts: one that started on August 18 and managed to recover 206 points, but upon reaching the 4540 zone it failed and resumed the downward path printing lower highs and lower lows that declared and confirmed a new downward trend.
The second bounce attempt started in the first days of October. After a terribly bearish September, SPX started October with a couple of down days, but found a floor at 4220, for 3 days the bulls defended that level. On October 6, the SPX opened negative and went south losing 17 points in the first few minutes, eventually touching the now important 4220 area which acted as a springboard for the SPX to bounce in an impressive snapback rally that sent it up 114 points, turning the session into a 1-day reversal with range and volume expansion. At that time, three of the SPX's market breadth indicators were oversold, something that is often the precursor of strong oversold rallies.
After this 1-day reversal SPX pushed higher for three days, touching the 4399 level, but got rejected and pulled back from there. Bears managed to mount a stronghold at 4385 and rejected SPX from that level for 6 days. SPX then got tired and, with no more momentum to go on, started a rollback that took us all the the way back to the initial level of 4220, where it closed last Friday.
¿What do we expect from here, are we at the end of the correction or are lower SPX prices awaiting us?
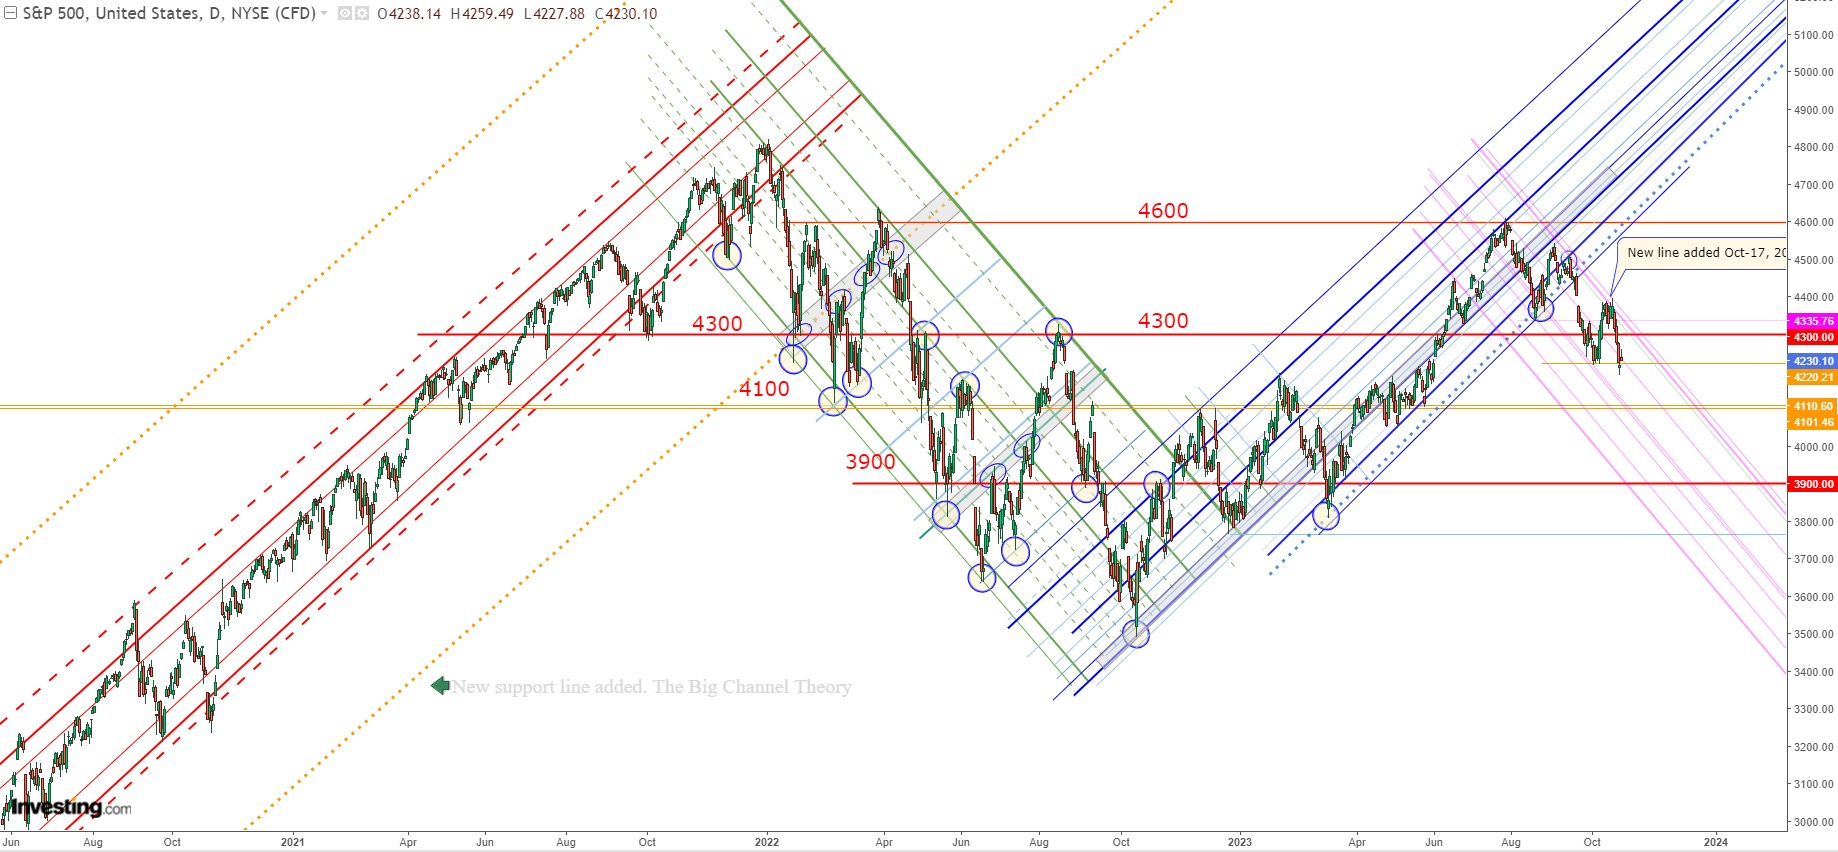
To discern the answer the first thing we look at is our old faithful market map. This map that we started drawing in 2020 has since allowed us to spot and trade important levels, bottoms and tops. Its lines don’t resemble most of the charts we see today from other analysts, but we must not forget that these are only parallel lines born from the two-year 2020-2022 bullish channel, the entire downtrend of 2022, and the bullish leg of 2023.
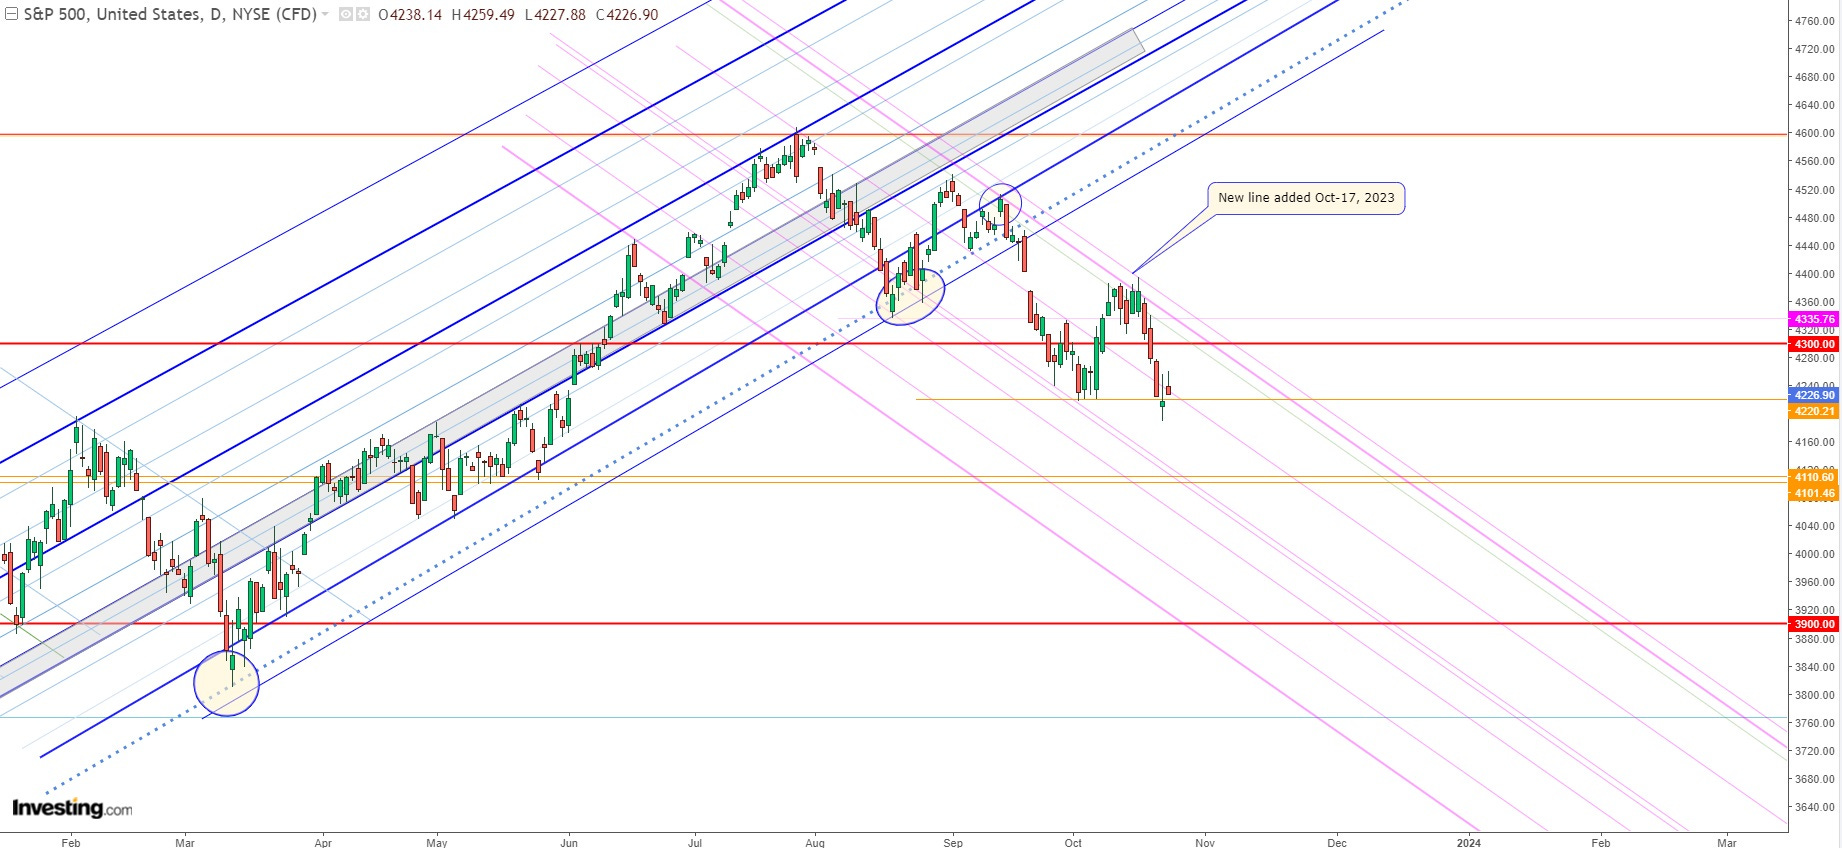
What does this market map tell us?
It shows us, without a doubt, that what started in July is not a normal correction, as it validated on September 20 the birth of a new downward channel, which was solidly confirmed in the following days. One thing is for sure, as long as SPX stays in this bearish channel it will fall to lower and lower territory.
This descending channel does not predict whether SPX will go down to this or that level, but it does give us the necessary guidance to know when the downtrend will end. To achieve this, SPX must first break above this downward channel (which may need extensions given how narrow it is at the moment) and either reinsert itself into the old uptrend channel or start building a new bullish channel. So far neither condition has been met.
Will SPX go lower?
As long as the above conditions are not met SPX will remain in a downtrend and as such will continue to decline. A big sign of weakness and perhaps indicating that this downtrend has more life in it was the 5 days of rejection SPX suffered at the upper edge of the channel in recent days. Further weakness is reflected not only in the fact that SPX recently violated 4335 (low of Aug. 18, 2023), and the critical 4300 (August 2022 high) considered by many to be a critical borderline separating the bear market from the incipient bull market, but also because the sucesive lower lows and lower highs in its chart. At the moment, however, SPX is very close to a strong support zone between 4181 and 4200 from where we expect it to mount a rally of some magnitude.
4200 was a major resistance that SPX took exactly 1 year and 3 days to break. It will not be broken in a few days unless an extraordinary event occurs. Right now SPX is retesting this important breakout zone, its success will give SPX a chance to break the downtrend and resume its secular bullish trajectory, but its failure will declare a continuation of the 2022 bear market. If 4200 is breached 4181 should act as a strong floor for SPX to generate a sharp bounce.

What else indicates a possible strong rebound from this area?
•Market breadth indicators that although they have not reached extreme readings are at very low levels. Already in early October they had oversold readings, if SPX falls a little further a double dip would occur, which is often followed by rallies of significant magnitude and duration over time.
•This week, four major stocks will report their earnings results: META, GOOG, MSFT and AMZN, most likely earnings from these big players will help drive the market higher.
•Seasonality should be another factor that will help to float the market before year-end. Supposedly there are juicy flows coming into the market from October 15 to December 31.
•The 200DMA is at 4235 and should act as support or at least be an indicator of where the market wants to go.
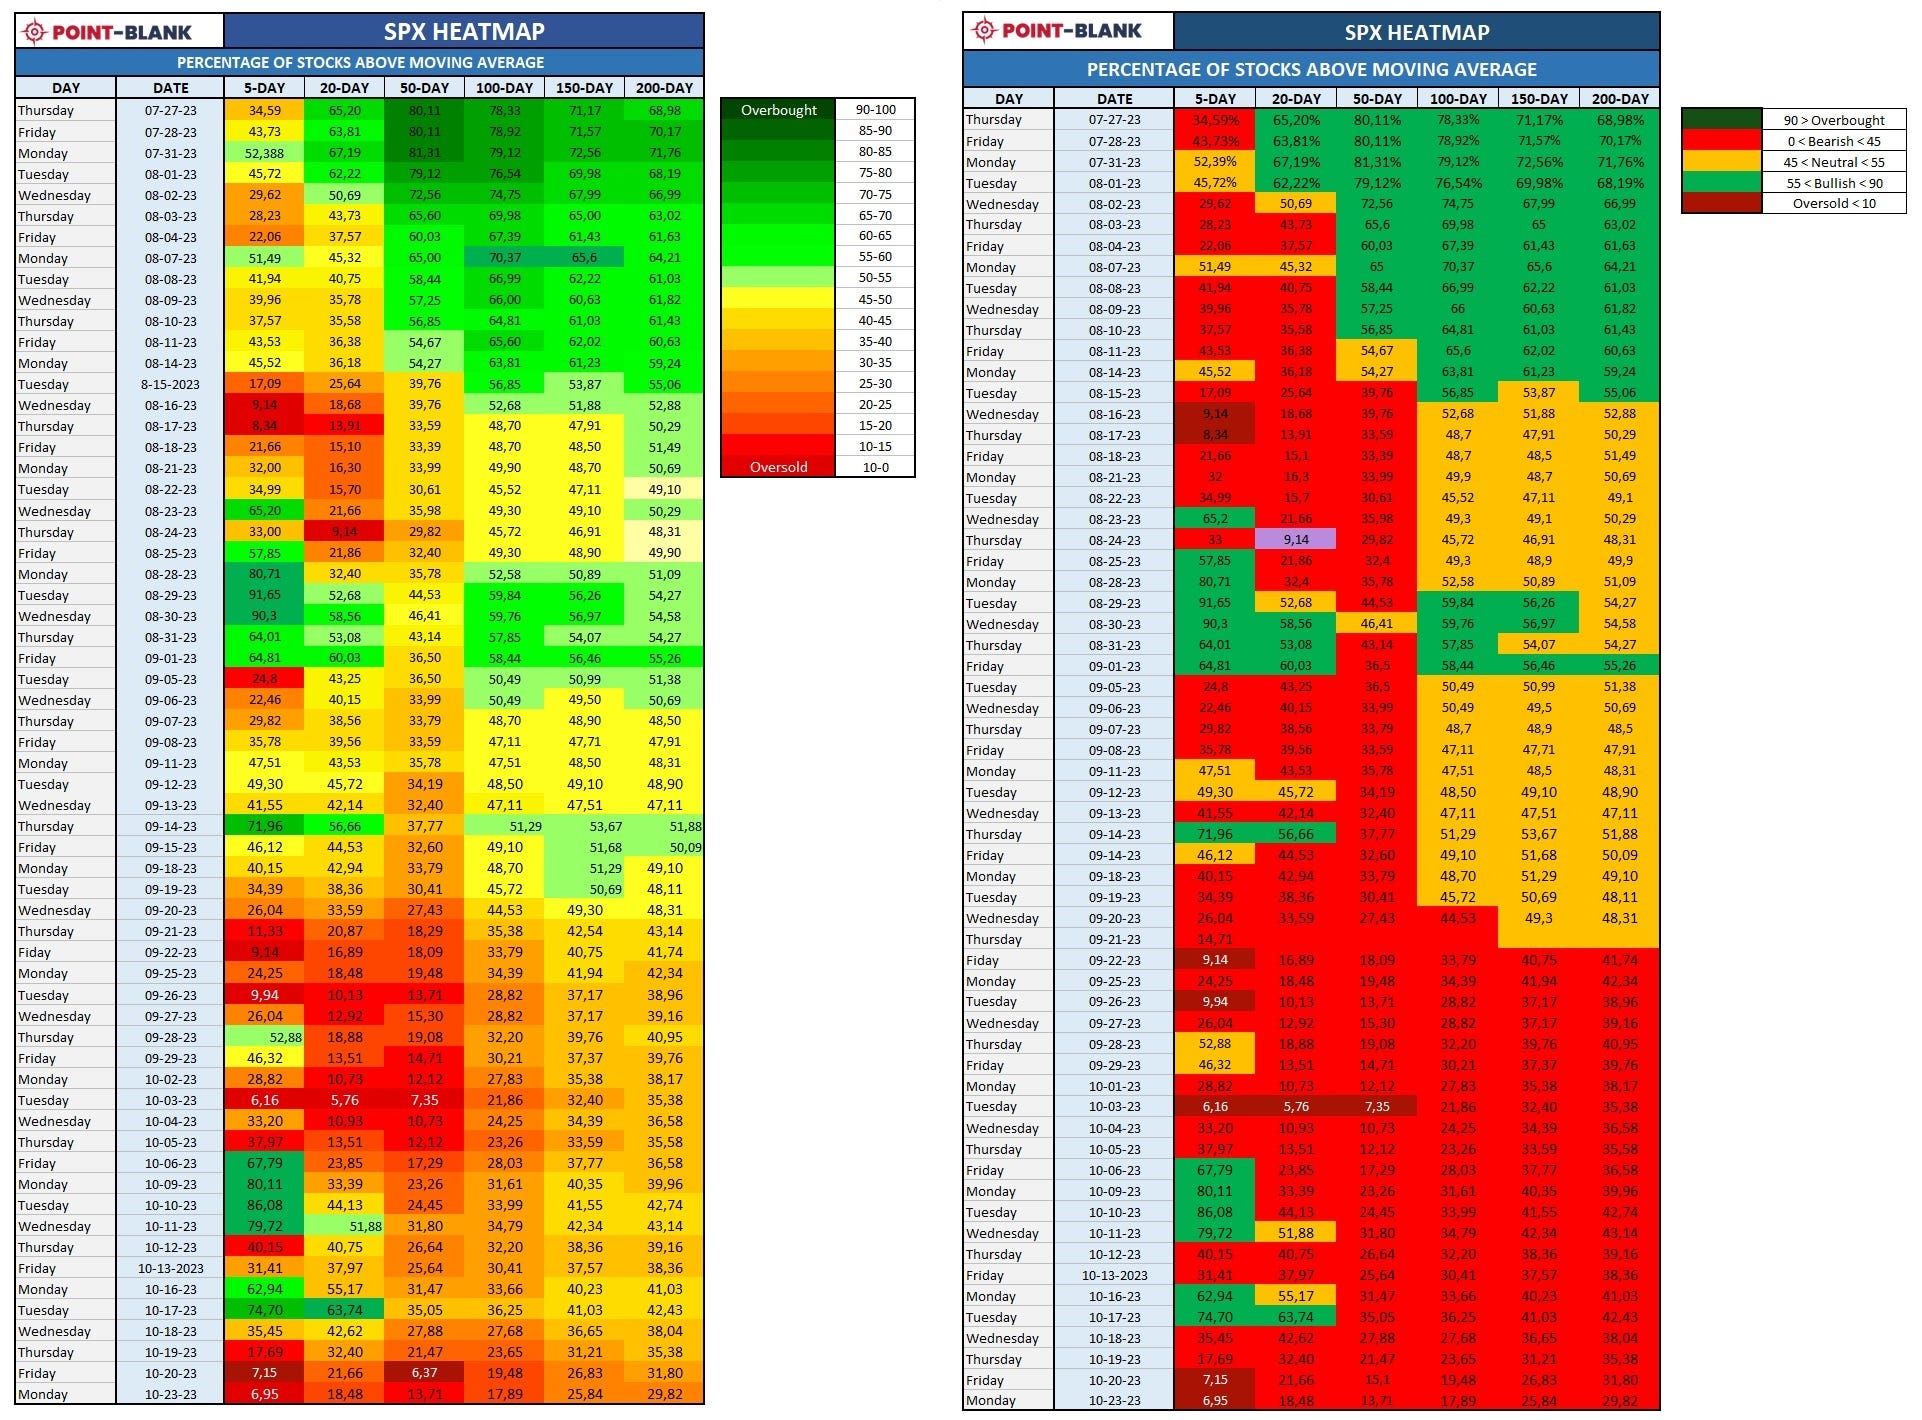
SPX Market Breadth
The second thing we want to look at is our SPX market breadth matrix. Our solid color SPX market breadth table shows that since September 22, the major breadth indicators (50, 100, 150 and 200 DMA) have remained red indicating SPX has been internally weak. That’s a reason why the recent bounce that started on early October failed just a few days later.
For the last four trading days all indicators have been fully red, and the SPX index of stocks above 5DMA has been oversold for the last two.
We also see a low reading of 13.71% for SPX stocks above the 50DMA index.
These low readings point to SPX being very close to a strong rebound, but it would be much better for the SPX to go lower first for these readings to reach extreme levels, which are always precursors to strong rallies that last for several days.
CONCLUSIONS
SPX has displayed several signals of weakness since July. The technical damage done on the charts would need a lot of repair to fix it.
SPX should bounce due to strong support in the current area.
What we need to see to believe that the July downtrend is just a strong correction and not the resumption of the 2022 bear market?
These are some of the conditions needed to negate a new bear market leg:
•Until yesterday, SPX has been making lower lows and lower highs. It should start doing the opposite by printing higher lows and higher highs. To accomplish this SPX must break above 4400.
•SPX and the rest of major indices have to return above their 20, 50, 100 and 200 DMA. For SPX those levels are 20DMA=4299, 50DMA=4376, 100DMA=4410, 200DMA=4236
•SPX major breadth indices (the % of SPX stocks above 50DMA, 100DMA, 200DMA) have to be above 50%
•SPX needs to breake above the downward channel. At this time that would be at least above 4335-4350, but remember that the current downward channel may need some extensions to get wider, it is too narrow rigth now.
•S5TH, the SPX stocks above 200DMA index, needs to stay above its 200DMA currently at 53.69%. The first step it needs to take is to get back above 35%.
•VIX has to get back and remain below its 200DMA (17.52) and below 15
•VVIX has to get below its 200DMA, and below 88
NOTE: Our SPX Bottom Spotter indicator is close to the first oversold level, but it is not there yet. Does the SPX need to reach extreme levels for a rally to occur? No, especially since the first bounce from those SPX lows already occurred on October 6, whatever happens now belongs to the "double dip" category, it is not a fully completed pattern, but it is close. That will guarantee a bounce of at least several days.

RECOMMENDATIONS
One thing we have to say, when all the breadth indicators are at extreme levels (or at least some of the big ones) a lasting and strong rally is triggered. When not at extreme readings, the rally can be strong, but not necessarily long lasting.
We have three recommendations_
♠If you are a bull pray for the SPX after a tepid bounce to fall hard to 4180, or just below, in order to push all the SPX breadth readings to extreme readings so as to trigger a strong and lasting rally.
♠If you are a bear pray that today's (10/24/2023) SPX bounce from 4215/4220 triggers a perhaps strong, but not worrisome or lasting rally. Look for a good resistance level and arm your trench there, so that when the time comes you can short the hell out of the market looking to break the 4200 floor on the next attempt.
♠If you are an unbiased trader, you should be glad of all these easy-to-spot trading opportunities. Trade the tape, make money and walk away.
Wish you all the best, but about all health and many profitable trading days.
May God Bless you all