

The ominous 4300, it's time to sell euphoria?
The ominous 4300, it's time to sell euphoria?
Market comentary for the week from 06-05-23 to 06-09-23. Gamma charts and data from @TradeVolatility. Elaborated by the Point-Blank Trading team.

REVIEW
The markets had a memorable performance last week, especially on Friday when many resistance levels were broken giving way to what could look like a new leg up that could confirm the theory that we are in a new bull market. At this moment we cannot confirm this theory.
The breakouts were important and confirmed by volume: SPX broke important monthly levels, closed above all its monthly moving averages, especially by the 20MMA.
But despite these great achievements, what we consider most relevant is the increase in market participation on Friday. That big jump in participation with an important IWM move improved the existing negative divergences, but they have not been fully healed. We would need more days of wide participation to fully repair those divergences and to be able to confirm as sustainable these strong bullish moves. Until this happens, we will continue to trade the tape, but we will keep an eye on the health of the horses that have pulled the cart this far.
To know if it is time to sell euphoria or to jump on the bandwagon, let's see what the charts are saying.
ANALYSIS
SPX / SPY / ES
Not much to say about SPX, ended the month of May with a bullish Dragonfly doji on high volume, closing the month above the previous month's close. That was a bullish performance confirmed by Thursday and Friday’s rally. The weekly chart ended in green with tiny wick at the top and above average volume.
Our old faithful market map says that the SPX has avoided taking the downward path (in green), but is now in the gray zone, an area of strong resistance that it needs to overcome to reinsert itself into the comfort zone of the bullish channel.

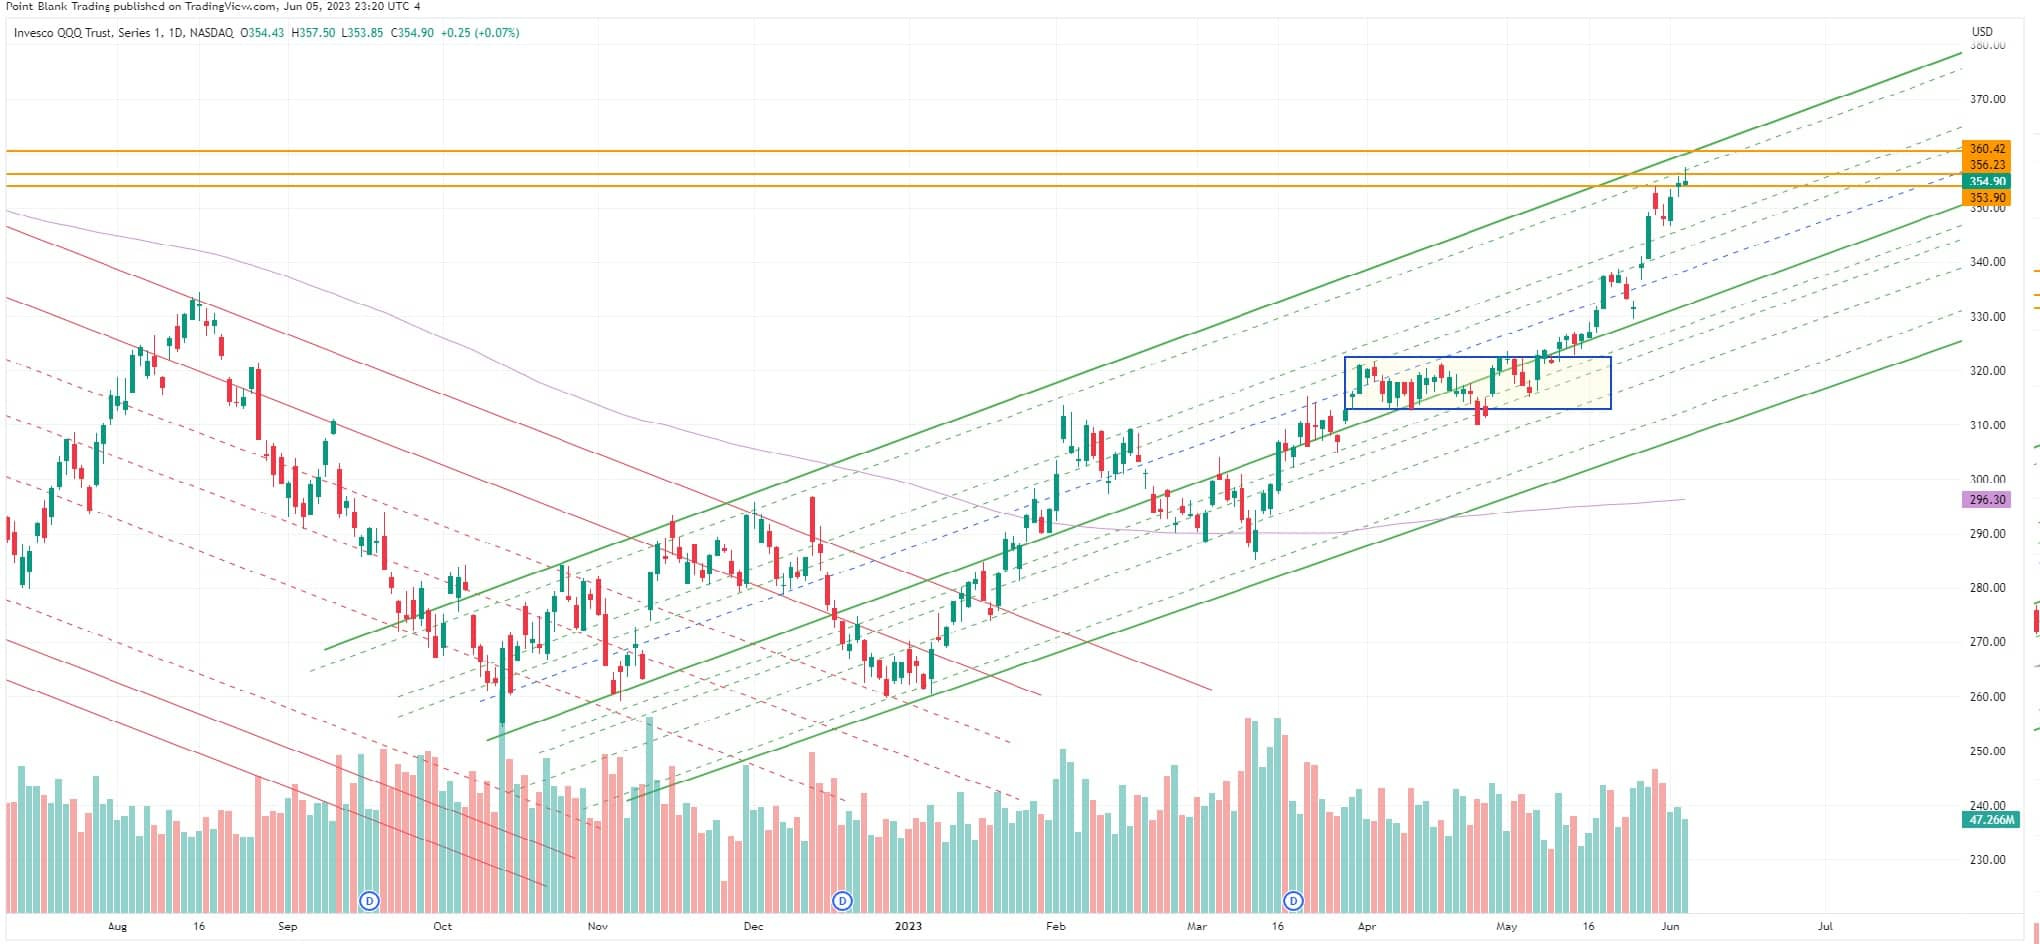
NDX/ QQQ / NQ
The locomotive that has pulled the train of a thousand cars closed May with a green impulsive candle and high volume. Bullish formation confirmed by continuation rally. The Weekly closed with a Hanging man pattern that could be considered bearish or indicative of a short term trend reversal. The Daily closed with a candlestick that could be considered a Spinning top, a bearish candlestick or indicating a temporary trend reversal. Possible downward pression this week.
DJI / DIA / YM
One of the most striking advances was that of the DJI with an upward movement of 701 points (+2.12%), not only because of its magnitude but also because this important indicator of the economy lagged in the rally, managing to decisively overcome the congestion zone between 33276 and 33374 where its 20DMA, 50DMA and 100DMA congregated. It needs to approach and surpass its May highs at 34257.
It closed the month of May with a bearish candle with high volume. DIA closed the week with a bullish engulfing candle on high volume, and YM futures closed with less volume than the previous week.
DJI faces strong overhead resistance.

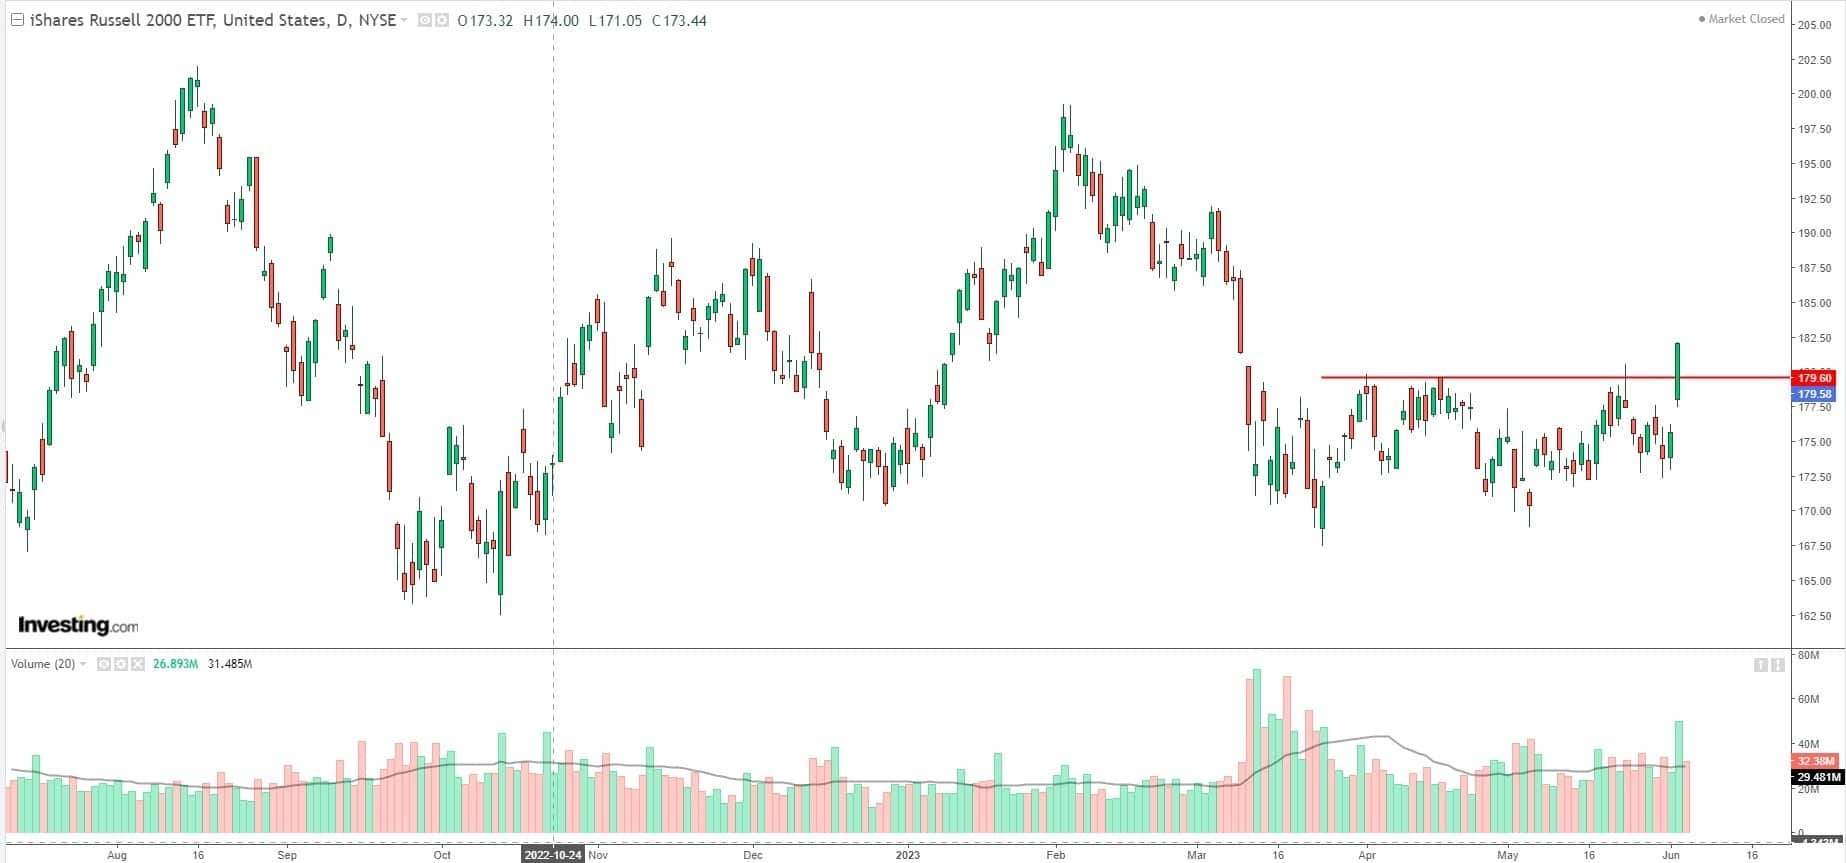
RUT / IWM / RTY
The most impressive move was caused by RUT which managed to advance +3.56% on high volume, closing for the first time since March above its 200DMA and breaking solidly above its noise box.
It closed the month of May with a red candlestick on high volume which could be considered a spinning bottom pattern, signaling a trend reversal. The weekly chart closed with an impulsive bullish candlestick on higher volume. It closed at the convergence of 20WMA, 50WMA and 200WMA, managing to close above the first two, but below the latter.
This increase in small cap participation in the rally bodes well for the bulls, but it needs to hold until it catches up with the rest of the market for negative divergences to correct.
DJT
This is an index that should be at the forefront of this rally and yet it is one of the laggards. Its Friday move was positive and on high volume, but not as impactful as the DJI and RUT. It needs 14214 to join the rally.
May closed in the red, but it is worth noting that this was its third monthly candle in the red on falling volume. The weekly close was positive, but on lower volume than the previous week. It managed to close above its 50WMA.
Of note, the transportation sector ETF represented by XTN performed much better on Friday as it closed with a gain of +3.11%. The difference is due to its different components with DJT's being wider.
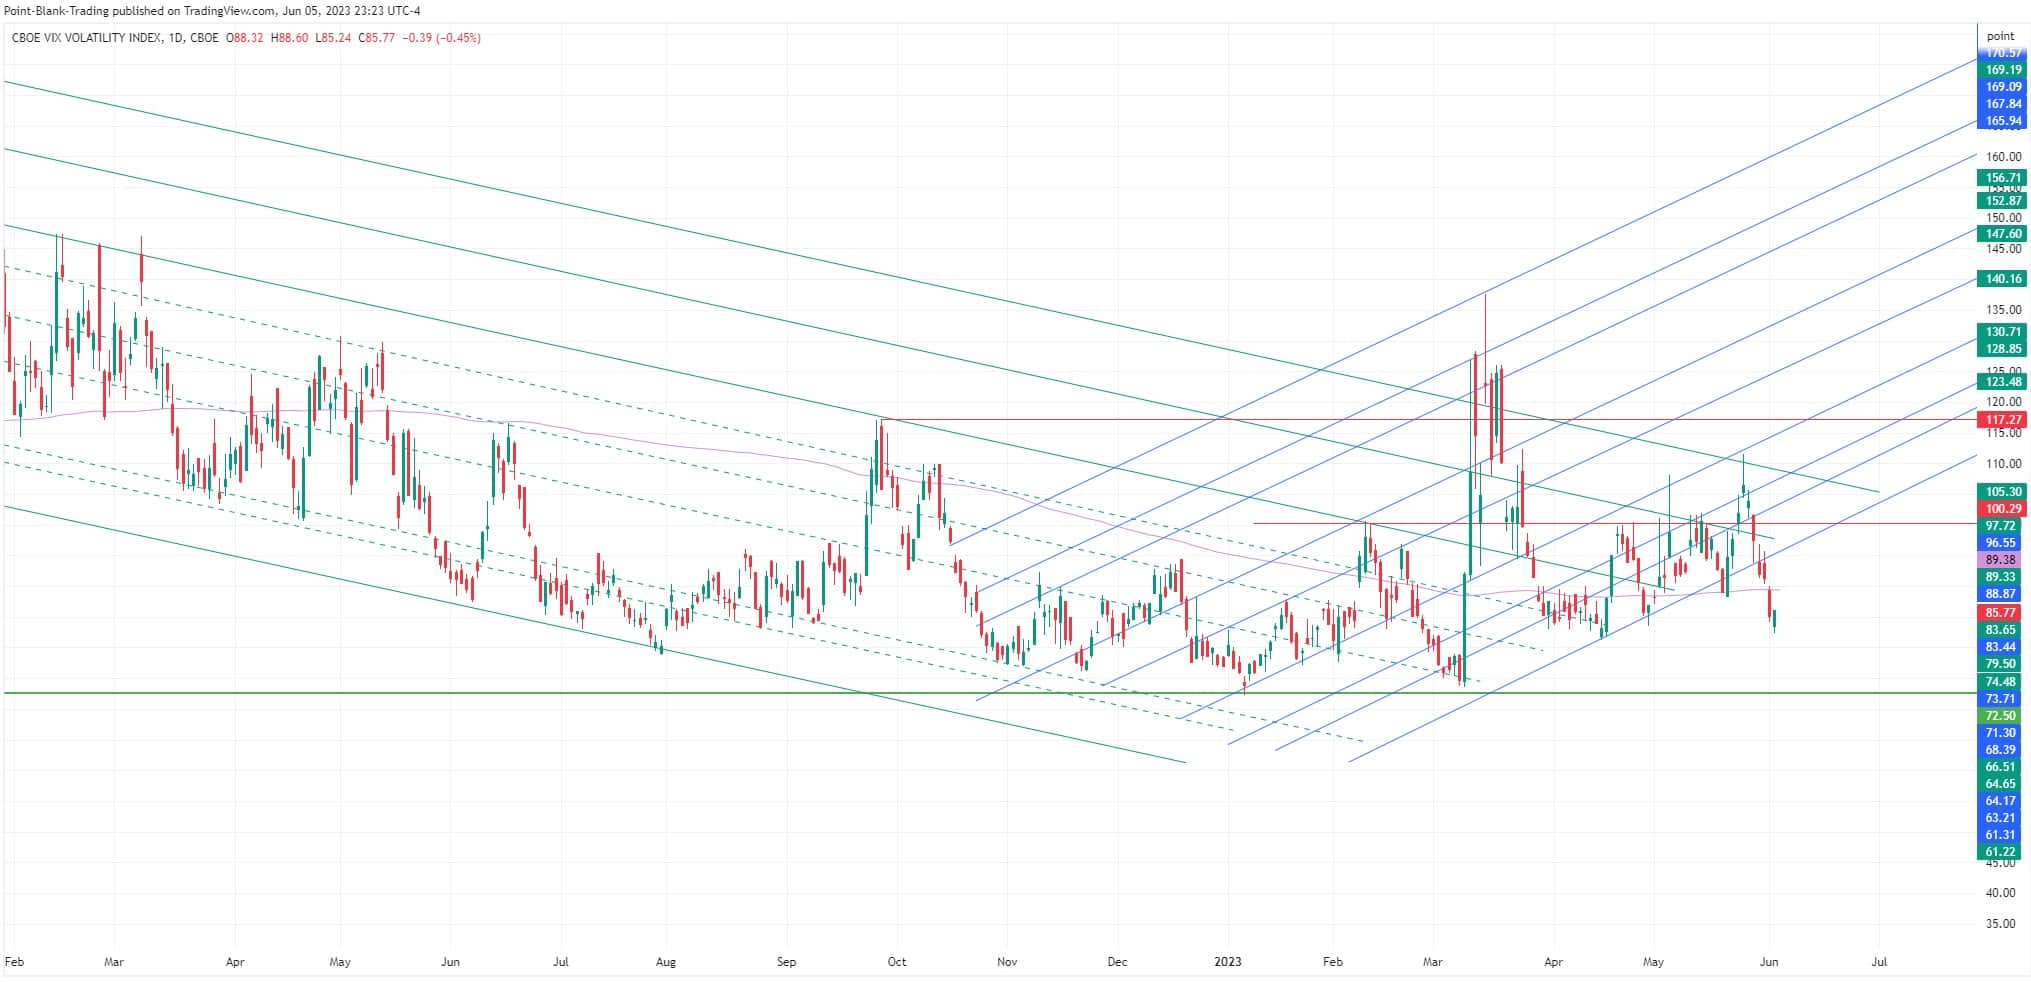
VIX / VVIX / VIX1D
You see a lot of comments about VIX breaking below 15 with a close at 14.61, but no mention of the important support level that exists between 14 and 14.50, and those who mention that this is an unusual low for VIX also don't seem to remember that from December 2012 through January 2020 VIX lows stayed between 11 and 12 with the exception of between January 2017 and April 2018 when it dropped even lower staying between 9 and 11.
On its monthly chart it looks right at support and below all of its moving averages. On the weekly it would be the 10th week closing below its 20WMA from where it has been rejected on several occasions.
VIX is still stuck in its downtrend which is somewhat consistent with the bullish performance of the market. Let's keep an eye out for a possible bounce from the support zone where it is.
VVIX Thursday and Friday below the lower edge of a bullish channel that it had so far respected and also below its 200DMA, however on Friday it closed positive incongruent with the rally that the market had that day. This is a negative divergence for SPX, but we should wait for a confirmation in the next few days.
On the monthly chart it remains below its 200MMA which it has not managed to overcome since September 2022. In the weekly chart it closed below all its moving averages including the 50WMA which had served as support.
It must resolve the wedge in which it is for it to take a definitive path.
MARKET BREADTH
The highlight of this week's move is the sudden increase in market participation on last Friday's move, with an impressive NYSE Adv/Dec ratio of 5.63. More than 5 to 1 ratio that surely breadth scholars will considered to be a “breadth thrust”, a push in the direction of momentum. This is very constructive for the bulls.
If we look at the Total Market, which includes the three major stock exchanges, NYSE, Nasdaq and AMEX, we have an Adv/Dec ratio of 3.86, with 70.4% of stocks advancing and only 20% declining. The New Highs/New Lows 5.33 nyse 2.38 nasdaq.While all that advance is positive, our favorite indicator of the SPX's internal health, the SPX stock index above 200DMA is still not at the right levels, it closed above 200DMA, but is still below the critical 50% level, and below the most recent trend lines. It has been rejected from 20DMA several times, it must conquer those levels to sustain this rally.

GAMMA
One of the most story telling things this week is Gamma, basically all of this week's expirations have a significant Gamma stack at 4300, and more than that is the biggest stack of Gamma for all expirations. This fact combined with the horizontal resistance levels, make 4300 a formidable obstacle to defeat.
June 16, Monthly expiration, has a big Gamma exposure at 4300. These are stubborn positions that won’t be moved or rolled. It seems that SPX won’t be able to cross 4300 until after MOPEX.


OUTLOOK
The market is looking very strong with Friday's large advance on high volume and range expansion, but even so this is still a cart pulled by a handful of horses: FAANG, Semis, etc. They are very overextended; any fatigue, weakness or sickness can abruptly stop this march and cause vicious pullbacks. Some signs of weakness are starting to appear, for example, NVDA one of the most overextended stocks went down on the day of Friday's big rally. Why? Sector rotation?
Right now the market is facing a major resistance at 4300 that in our eyes has always been like the border between bear market and bull market. If we take into account Gamma, resistance, market breadth, retracement channels, etc., we have the ingredients for a decent pullback that should lead us to at least retest the breakout zone at 4220. Let’s not forget that 4250 is a level with a good accumulation of Gamma and could render inmediate support.
Even if the market attempts to continue to move higher, there is little room left for the indices before running into major resistance. For SPX first 4300, next 4313, and last 4323, for DIA 341, for QQQ first 456 then 460, for IWM 187.
We expect the DJI and IWM to outperform SPX and QQQ this week.
Tuesday has had a weak behavior for several weeks, so maybe that’s the day when the down move will begin, but we would prefer the market to hit resistance first.
The market may close at 4300 by June 16, but it may need to take a walk to lower territories first.
Have a nice and productive trading week, sorry for being so late.
Hello Point, I was curious if you were refunding subscription? I payed $80 for the year, or your first introduction price. I believe you went another direction?