

Will the rally continue?
Will the rally continue?
Market Commentary for the week from 03/06/23 to 03/10/23 • Issue No. 26 • Analysis and Outlook elaborated by @PointBlank_Algo • GEX charts and data by @TradeVolatility

REVIEW
The market confirmed our view that a major bounce was to be expected this week. We said 3 weeks ago that the market should rest a bit and that it looked overbought, we said we expected a retest of the breakout zones. The pullback came and the market fell for 3 weeks, but it did so on decreasing volume. Not on lower volume, but on decreasing volume. That showed us lack of motivation from sellers. It was a bullish signal.
In addition to that, the SPX had reached what we called a Convergence Zone where the 50DMA, 100DMA, 150DMA, 200DMA, and major trendlines were having a meeting. It was hard for us to see the market falling below that zone.
Those reasons, plus positive RSI and Stochastic divergences, and our reading of other indicators pushed us to go out and forecast a multi-day bounce starting this week and call our latest newsletter "Ready for a Bounce?"
We expected the rebound to start on Monday or Tuesday and indeed on Monday it opened with a gap up of 38 points and after rising another 10 points it started to reverse and although it ended positive it lost a good part of the gains. That got the bears excited and they did their best on Tuesday and Wednesday to take the market down.
As several indices had not reached their breakout zones for the retest, we clarified in our newsletter that perhaps SPX would need to get close to 3900 to have a meaningful bounce. The rest is history.
Odte options and implied Gamma of course played a role in the week's movements. What started as a regular bounce from support rode a rocket thanks to the options ladder above key levels like 3950 on Thursday and 4000 on Friday.
The huge volume above those levels in all consequetive strikes up 30 - 50 points pushed the market higher, and as it went up without looking back, short sellers had no choice, but to buy buck their bets and propelled more the market in a short squeeze of big proportions.
How far will the market go? Let’s find out.
ANALYSIS
SPX / SPY / ES
The first thing we should mention is that in contrast to the market falling on decreasing volume this week it rose on higher volume. It managed, of course, to bounce off the 200DMA successfully and convincingly and break and close above the 50-week average.
The first hurdle SPX will face will be the 20DMA acutally at 4060. This is an important hurdle, but much more important will be the floor of the Noise Box we have tweeted about since June of last year. That critical level, also the ceiling of the current box is 4074.
The current box has a record of holding the SPX in that area an average of 16.75 days, SPX has barely been there for 9 days so we believe SPX will be rejected on its first attempt to close above 4074 and it may take several days before it can enter the Noise Box. If that goal is achieved in order to continue its advance, SPX will need to break above the short term trend line which it should find near the 4095-4100 level.


DIA / DJI/ YM/ DJT
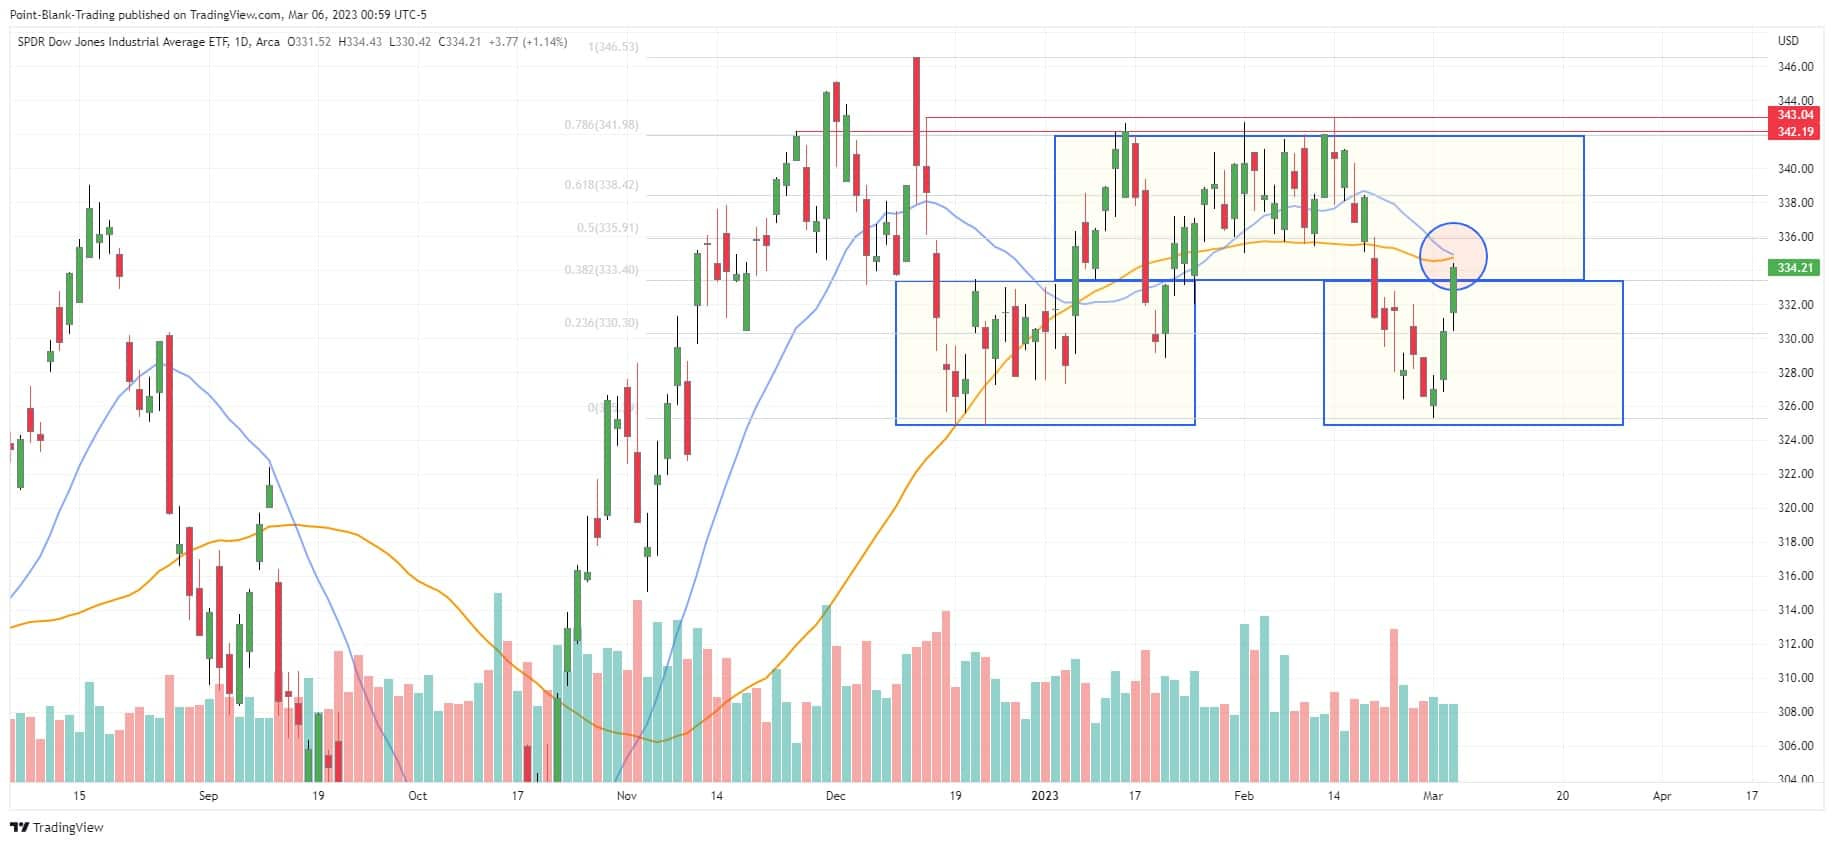
Both daily and weekly volume on DJI was not as convincing as the SPX, however it managed to bounce off 150DMA and DIA managed to break above the important 333.5 level which is the floor of one of our boxes marking consolidation or congestion zones.
DJI was hit during the pullback and now has the huge challenge of overcoming the confluence of 20DMA and 50DMA in the 33520 area.
DJT was luckier and closed above all of its moving averages on daily charts and did so on high volume on Friday. Weekly volume was slightly higher. It also managed to break above the short term trend line and the important barrier at 14717, which is the ceiling of a congestion area . The target to reach now is 15900. It should be noted that Thursday's candle was very bullish, but we would have liked to see more range expansion on Friday
.
QQQ / NDX / NQ / IXIC
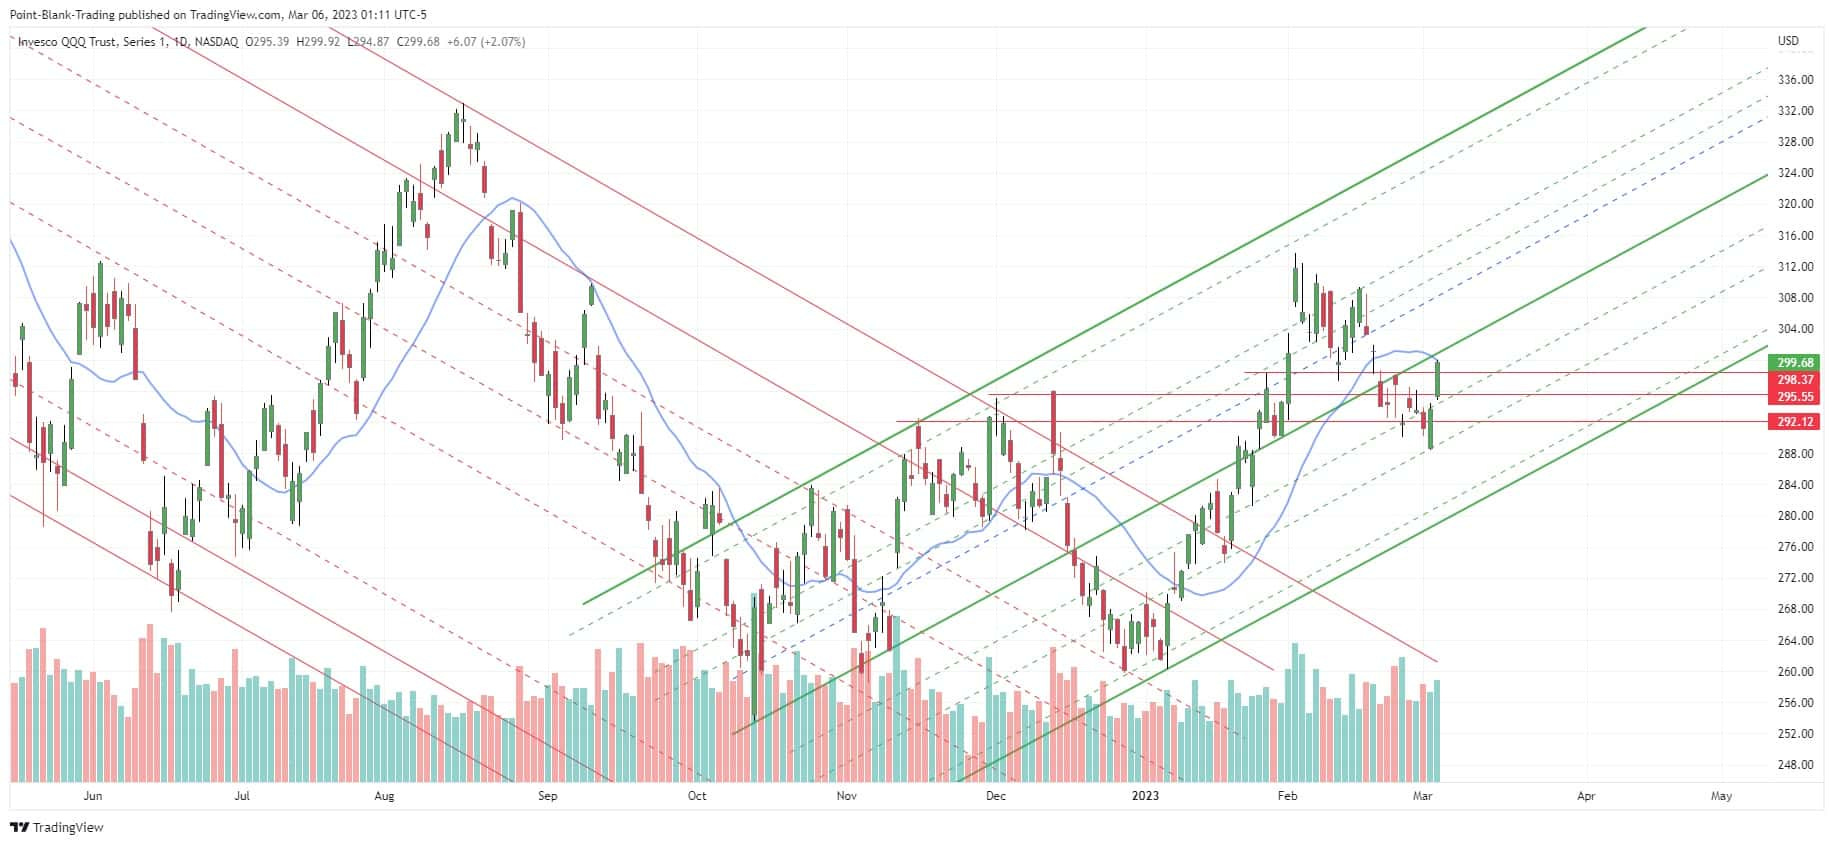
It bounced sharply from 150DMA. The strong advance on Thursday and Friday, made on high volume, led it to touch a 20DMA currently located at 299.96. It managed to close very close to it and to an important trend line, so we should not be surprised by a little retracement from these levels to be able to absorb all the buy orders crouched in these areas. The bulls have to prove they are in control and move the price above the $300 level where the mentioned resistances are located.
On the weekly chart it broke above the 50DMA and closed with a bullish candle on high volume. The next target is 300 and then the very important 314.
IWM / RUT / RTY
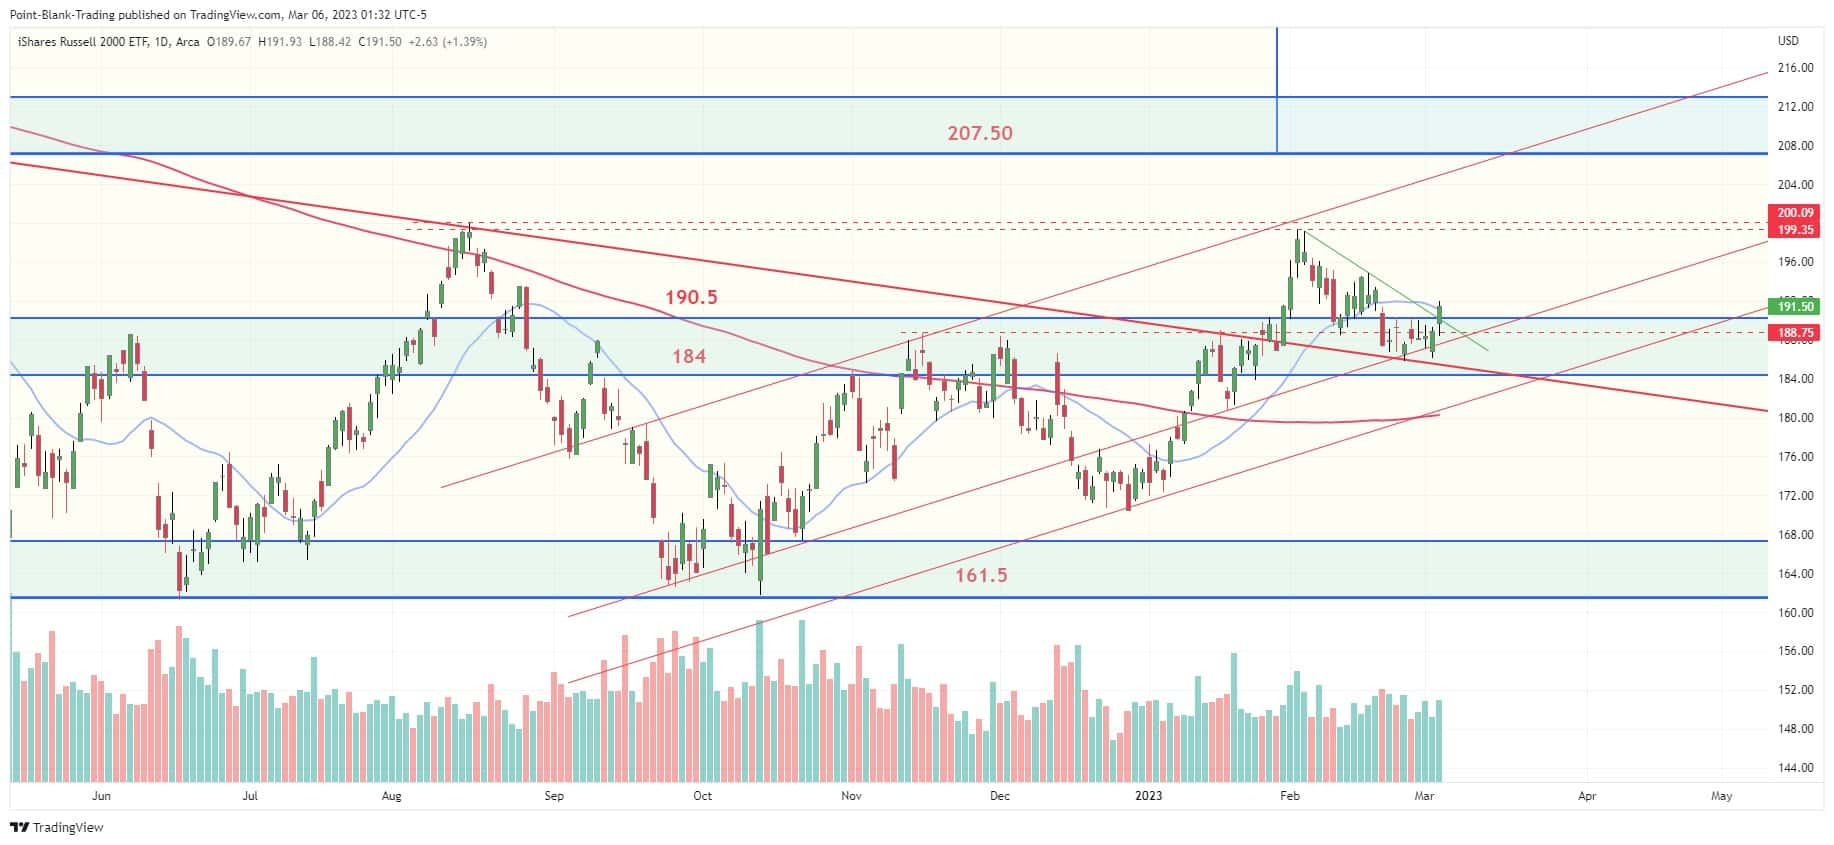
The small-cap stocks represented by IWM performed very well. First, having been the leader of the rally, it was ahead of the other indices, never violating, for example, the 50DMA. It managed to overcome slightly above the 20DMA, an important resistance at 190.5 and the short term trend line, doing so on high volume.
In the weekly time frame it managed to break above 150WMA and the downtrend line that had been in place since March of last year. IWM started this rebound from the previous week and confirmed it this week. Weekly volume was only slightly higher. The target is now 195 and then 199.
VIX / VVIX
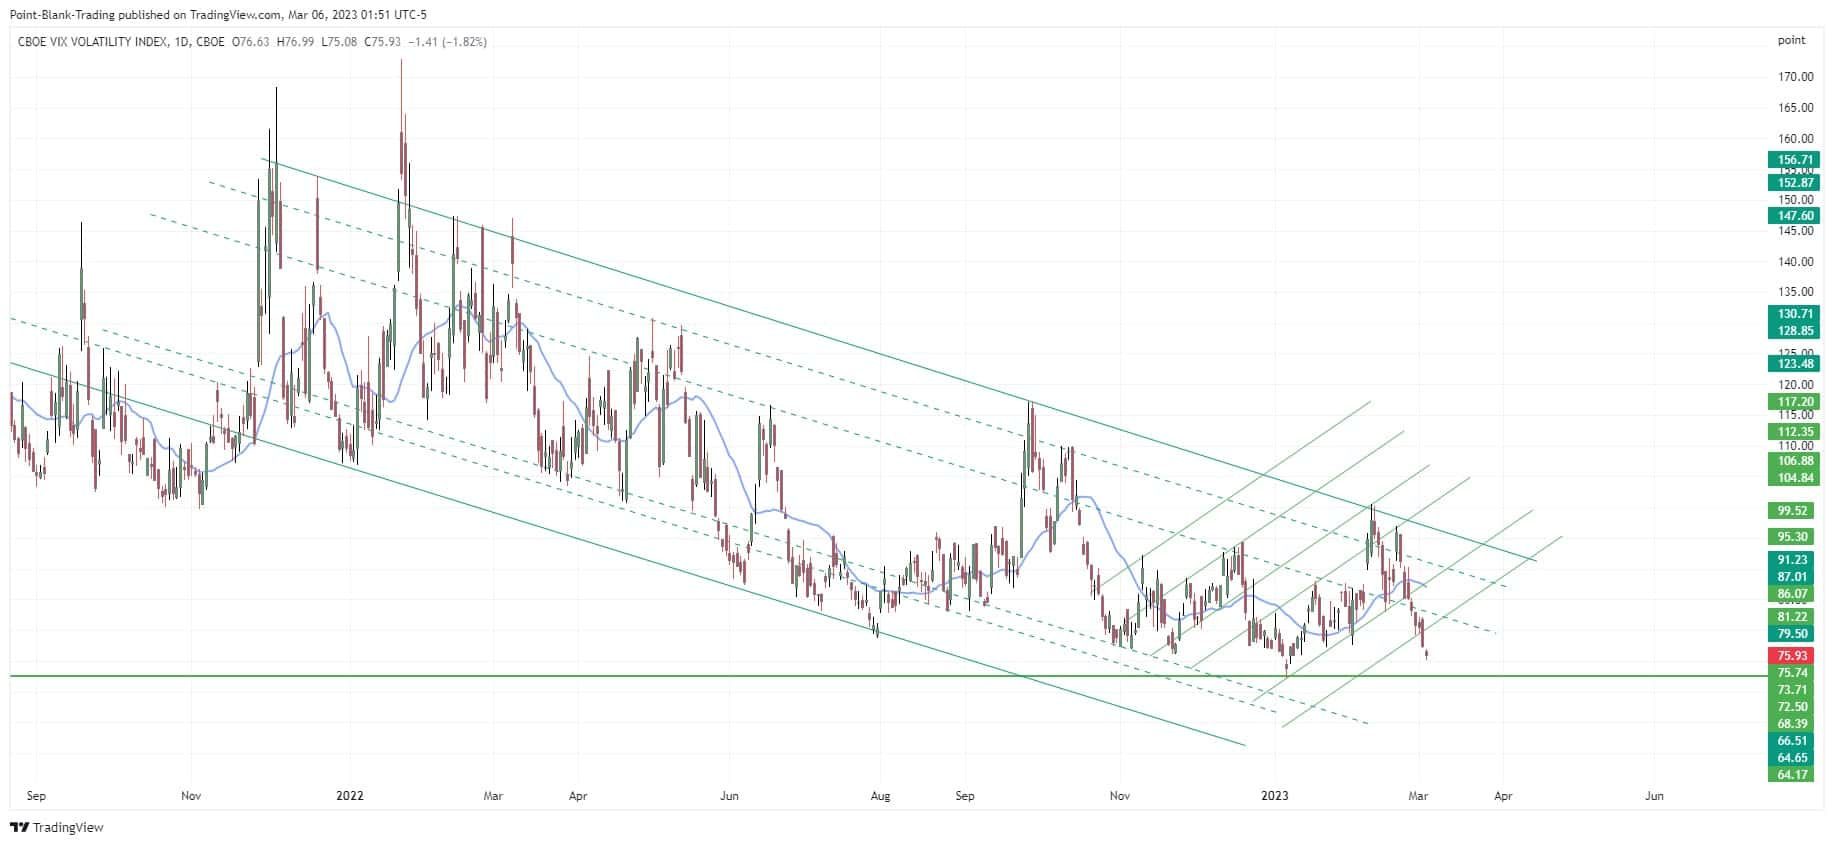
Last week we said in our newsletter that VIX “looks like it could move lower before trying to move higher again” and added “To see what VIX could do let's take a look at VVIX” “…(VVIX) seems to continue in its strong downtrend” and concluded “Unless VVIX breaks the dominant downtrend line, we expect it to remain in its downtrend”
After a rally attempt on Monday, in which despite the SPX reversal, VIX also reversed and ended with a long red candle. This set the tone for the week which VIX ended with a loss of 14.76% closing below the 20DMA. It is approaching major support at 18 and that is coincident with the indices reaching important resistance levels, it may touch it and have something of a bounce from there, but until it breaks the 200DMA currently at 24.39, or at least the short term trend line that has been in place since December 2022, it will continue to be trapped in a strong downtrend.
Keep an eye on the fact that if VIX breaks solidly below 18 it will be a very strong bullish signal for the SPX. In fact, according to the metrics we track, VIX generated a strong buy signal on the SPX on Thursday. We didn't mention it on our Twitter feed because of how disconnected VIX/SPX have been. The break of support at 18 would take VIX to 15.
VVIX in sync with VIX is also near important support at 72.50, so it is quite likely that the market, after last week's strong move, will approach resistance and have a pullback which will coincide with VIX and VVIX reaching support and bouncing. At the moment we do not believe that the rebound of the VVIX and VIX will pull them out of their strong downtrends.
Fib Retracements
We have added this week a review of the Fibonnacci levels of the last leg down because it seems relevant the fact that none of the major indices managed in last week's move to overcome the 50% retracement.
The overcoming of these levels will give more bullish validity to the bounce that started on Thursday last week.
These are the levels:
SPX 4061.80
SPY 405.2
DJI 33607
DIA 335.71
NDX 12355.54
QQQ 301
RUT 1941.56
IWM 192.52
CLASSIC INDICATORS (SPX)
The positive divergences we pointed out in our last newsletter proved to be correct, as there was a strong rebound.
This week Stochastics, CCI and Williams %R left the oversold zone and generated buy signals on Thursday.
RSI crossed above 50% also on Thursday.
ROC and MACD have not generated buy signals yet.
Overall positive consensus. None of the indicators have reached the overbought zone which makes us believe that the market still has room to move higher.
BREADTH INDICATORS
ADV/DEC line, Put/Call ratios and New High/New Low line change direction and generated buy signals on either Thursday or Friday and are all now in Buy.
The SPX stocks above 20DMAindex, the most sensitive of these indices, went from a high of 87% in January to a low of 11.92% two Fridays ago, however the important support we have marked at 14.40% managed to hold after being challenged several times in the last few days. With the advance of the market this indicator managed to close at 38.56% last Friday, but it is still below all its moving averages. A close above 50DMA would give validation and more legs to the rally started last Thursday

The SPX stocks above 50DMA Index managed to stay above the 40% level and also broke above the 200DMA. A close above 50% is key to the internal health and longevity of the rally.
The SPX stocks above 200DMA index, our favorite indicator of internal market health, managed to stay above the very critical 50% level. That level has served on multiple occasions in the past as support for SPX declines and as a brake on advances when the SPX is coming off a sharp correction. It closed slightly above the 50DMA, it would be very positive for the SPX that this index recapture that level.

On the weekly chart it printed a very bullish candle, a bullish hammer with long low wick, almost a Dragonfly Doji.
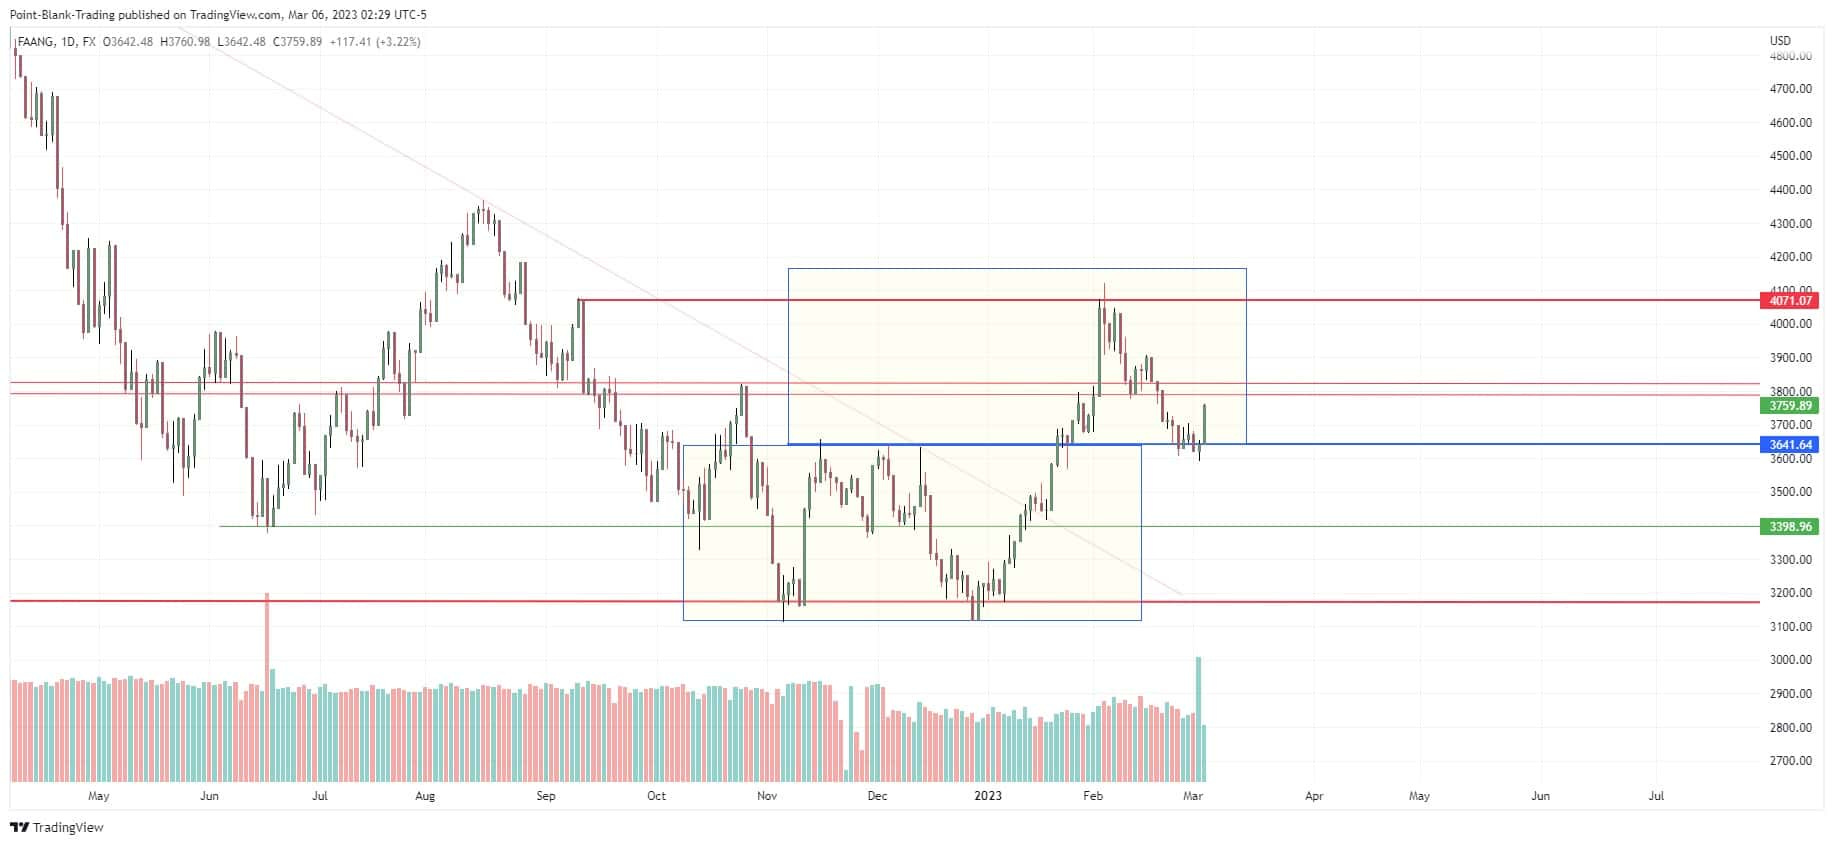
FAANG
Contrary to the other indices the FAANG stock index did not print a big green candle on Thursday but something more akin to a spinning top, which somehow also had a bullish connotation. On Friday however it moved up strongly producing appreciable gains of 3.22% for the day. That move confirmed the previous day's rebound from the 50DMA, crossing the 150DMA that had served as resistance in previous days.
It also managed to overcome the important resistance at 3633. The bad thing about this move higher is that it happened on decreasing volume, seeing Friday's major move on less volume than Thursday. Looking at the chart, it seems that Thursday's strong volume was an all out effort to save the index from breaking support.
It is noteworthy that all of last week's action was handled on lower than average volume. Weekly volume was also quite a bit lower than the previous 5 weeks.
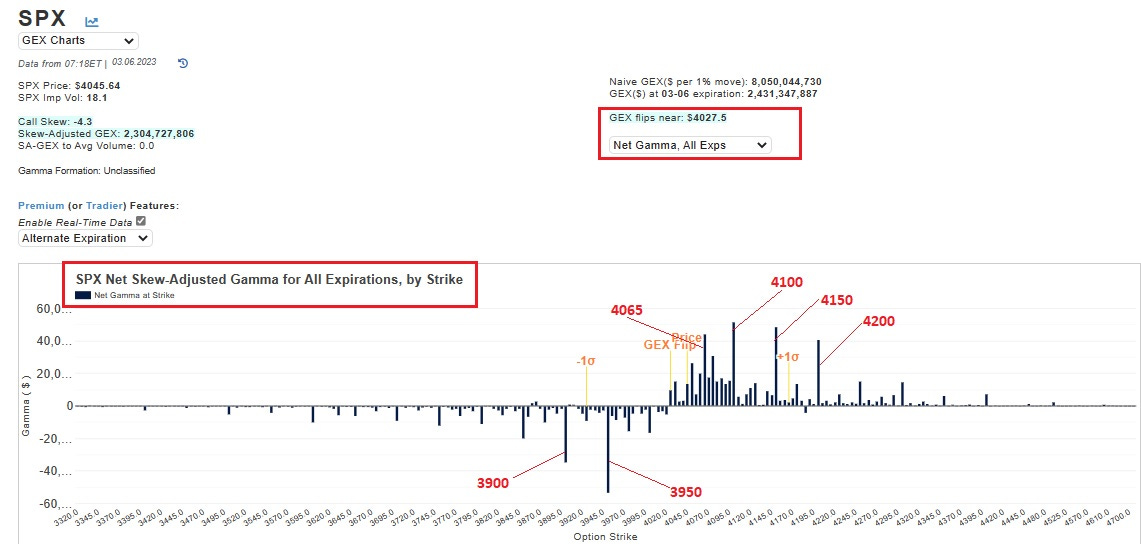
GAMMA/GEX
Data and charts from @TradeVolatility
Last week we had a chance to see in action the impact of 0dte options on market moves. Thursday at the open we had the main Gamma negative stack at 3950, it was the magnet. The SPX moved down to 3928 and by the time it got back up to 3950 it was in formation what our friends at @TradeVolatility name a Call Ladder, a structure that heralds a move to the upside (just as a Put Ladder does to the downside). Strikes between 3950 and 3980 began to see much higher call volume than put volume between 3950 and 3920. The large mass of Gamma that accumulated there ended up pulling the price above the strong resistance at 3950.
On Friday the situation was similar at strike 4000 and then 4020, the high volume on successive strikes of calls above 4020 led to break the resistances at those levels without major problems.
This week the Gamma chart for all expirations shows us how despite the persistence of an important negative Gamma stack at 3950 and 3900, the positive Gamma has been growing forming important stacks at 4065, 4100, 4150 and 4200, implying that traders' bets have become more bullish. We will be watching for the formation of call walls that could stop the rally that started last week.
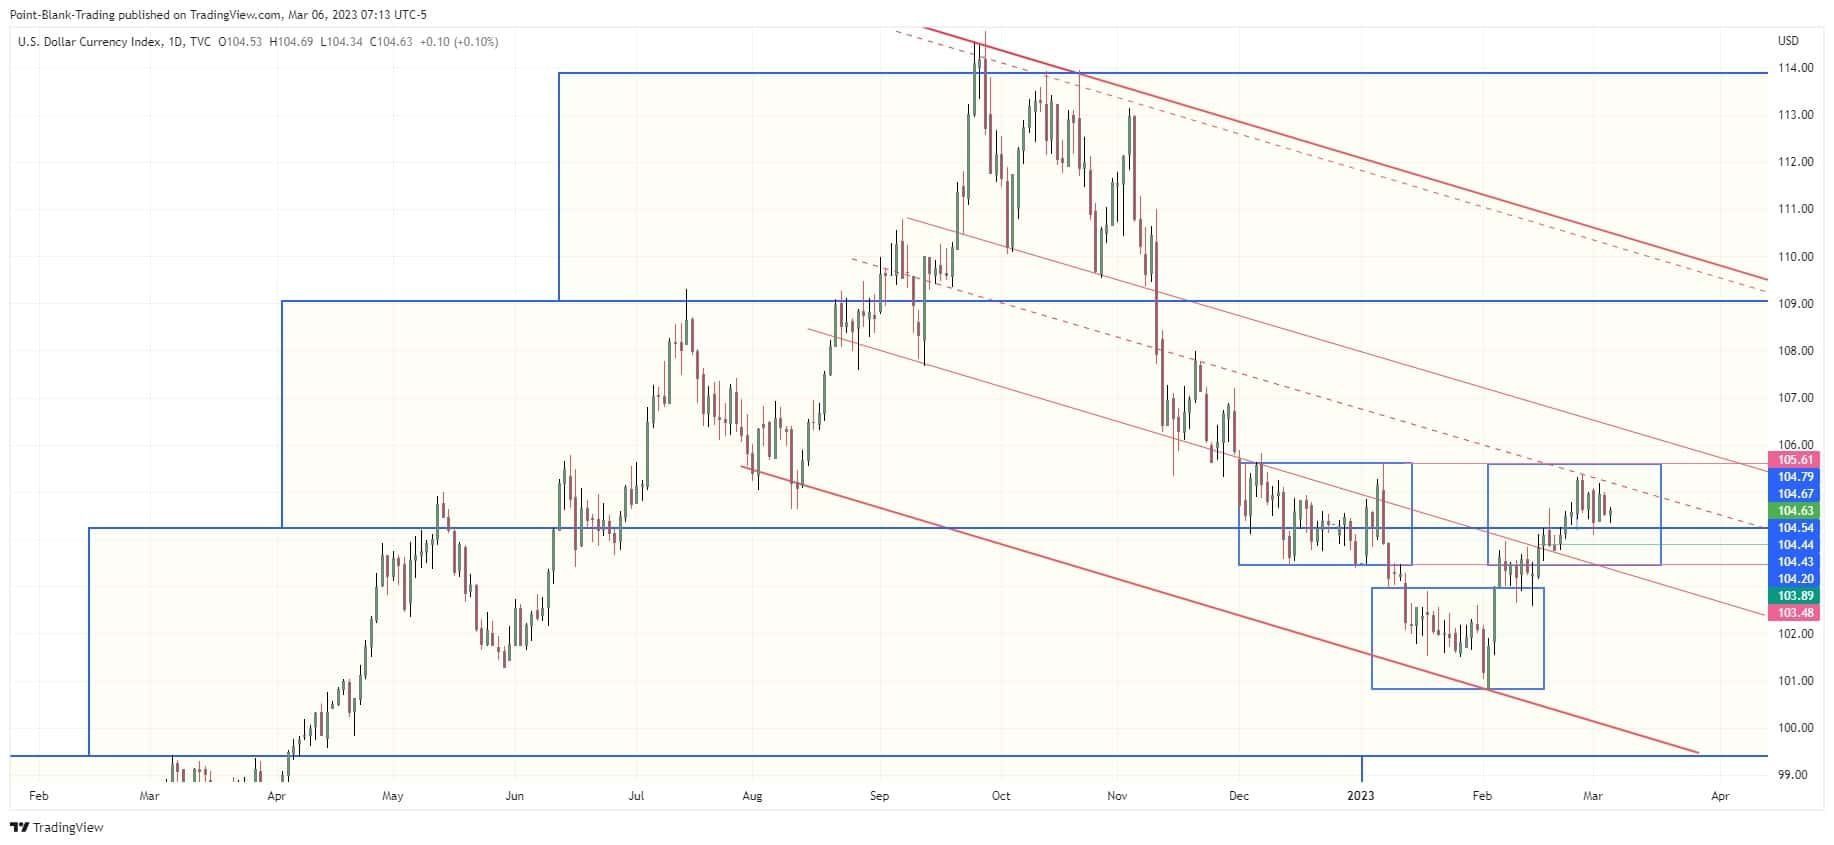
DXY
We said last week that we expected DXY, the dollar index, to remain in a range between 103.5 and 105.5, and very obediently it did so.
From a weekly standpoint we see how the 50WMA stopped DXY's advance the previous week, but in this just ended week it was stopped by the precipitously declining 20WMA which coincidentally crossed below the 50DWMA this week as well. Despite the macro aspect tied to the dollar's advance, it seems to have lost some momentum to the upside. From the point of view of the Regression channel losing 103.20 would be very bearish for DXY, if it continues to advance it would find resistance at 105.70.
We believe that DXY will remain below 105.65 for a few days yet.
XLF
As expected XLF was one of the sectors that helped float the market this week, it was one of the sectors that collaborated with Thursday's reversal. That day it broke below the 50DMA, but quickly recovered and closed printing an excellent bullish hammer. Friday's move was followed by a continuation and the open quickly recovered the 50DMA it had lost. Thursday's reversal move was in much greater volume than Friday's big advance.
The weekly time frame shows that the 20WMA support was one of the factors that favored Thursday's bounce/reversal. Friday's move also allowed it to close above its 100WMA, and it is now above all of its weekly averages. Something very important is that on the weekly chart it printed a perfect bullish Dragonfly Doji on high volume which gives us confidence to expect a continuation of the bullish move this week

SMH
Semiconductors was a sector that also cooperated with the market's rise, although it did not do so with much volume either on a daily or weekly basis.
It managed to close above the important resistance at 242.50 and a little above 50DMA. On the weekly chart it managed to overcome the 100WMA and printed a bullish hammer. Will try to advance, but does not seem as strong as before..
OUTLOOK
We believe that the uptrend started last week will have some legs. At Friday's close the major indices closed at or near important resistances, so we believe that although there could be an attempt to advance on Monday, it will not be of great magnitude, as we expect an initial rejection and profit taking at those resistance levels.
One of the obstacles that basically all indices will have to overcome to give validity and more legs to the rally will be the overcoming of their 20DMAs.
SPX 4060
SPY 405.18
DJI 33511
DIA 334.93
DJT 15058 (It close above it on Friday, needs to hold)
NDX 12309
QQQ 300
RUT 1926
IWM 191
XLF 36.19
We believe that SPX may remain several days unable to cross above 4074, but will eventually make it.
The pullback in the indices is expected to coincide with VIX bouncing from the important support at 18 and VVIX from 72.50, but we believe the volatility indices will continue in their downtrend and at best consolidating near those support levels.
DXY will remain below 105.65 for a few more days.
We will be watching for signs of weakness in the rally that started last week. Some news like the unemployment data or Powell's speech may have an impact on the current bullish momentum.
Always trade with caution, preserving capital is as important as generating profits.
Have a successful trading week.