

Powell, PCE, JOLTS, ISM, GDP, Non-Farm payrolls, who is going to kill the rally?
Powell, PCE, JOLTS, ISM, GDP, Non-Farm payrolls, who is going to kill the rally?
Market Commentary for the week from 11/28/22 to 12/02/22 • Issue No. 20 • Analysis and Outlook elaborated by @PointBlank_Algo • GEX charts and data by @TradeVolatility

REVIEW
It has been a lazy week with the Thanksgiving vacation in between. Many traders are taking the whole week off, so volume was expected to be low.
As anticipated, seasonality repeated itself again and there was a 1.95% upside move for the SPX between Tuesday and Wednesday.
Last week we set these targets:
“1) The rally to continue and to break above recent highs. Our inmediate target is 4074
2) DJI to continue leadership
3) FAANG index to eventually break above 50DMA
4) QQQ to eventually break above 100DMA”
We make the warning that probably that wouldn’t happen during last week, but will likely be this week.
“This may not happen all this week, but more likely by Friday next week all these targets will be hit.”
We achieved:
1) The rally to continue and to break above recent highs
2)DJI to continue leadership
Expecting to achieve this week:
3) QQQ to eventually break above 100DMA
4) FAANG index to eventually break above 50DMA
We expressed some conditions that could make us change our mind, but none of them occurred.
•IWM and QQQ closing below 20DMA
•SPX closing below 3900
•DJI closing below 33160
These conditions are maintained for this coming week.
ANALYSIS
DJIA / DIA / YM
The Dow Jones Industrial Average continues to be the leader of this rally, closing above the August high on Friday.
DIA, its ETF, did so in the previous session on Wednesday, making it two days above the August high. It did so on low volume, but as we said this is a low volume week in general.
We expect the DJIA to continue to lead this rally and chase the 35000 level and eventually the 36000 level.
One bad omen is the 50WMA crossing below the 100WMA, something that has not happened since 2008. That crossover is consistent with the idea that this is still a bear market rally.
For the 50WMA to cross back above the 100WMA the DJI will basically have to make a new high or at least reach the all-time high.
RUT / IWM / RTY
IWM managed to close back above the 200DMA on Wednesday with more volume than the previous day, however RUT is still struggling to get above it. It closed right at it as did RTY which closed at the 200DMA.
We expect them to close above the 200DMA on Monday.
NDX / QQQ / NQ
The technology sector remains one of the weakest sectors in this rally.
Neither NDX, QQQ nor NQ have managed to exceed the 100DMA. We expect them to do so this week, with the QQQ looking for the 293/295 area.
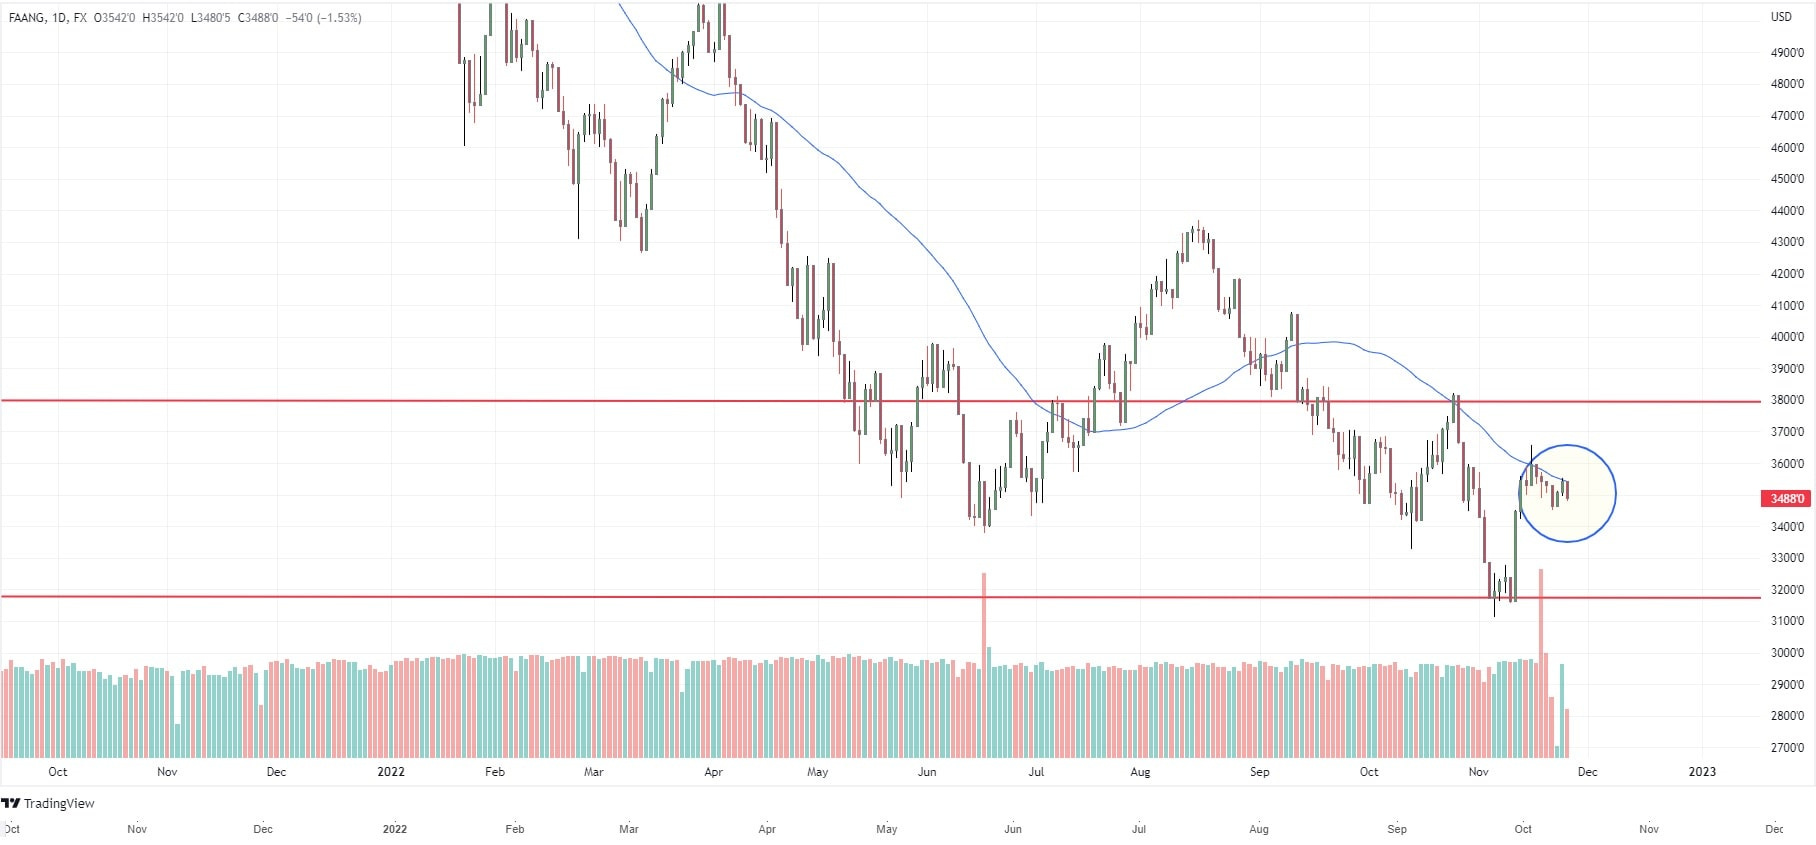
FAANG
The FAANG stock index failed to cross above the 50DMA. On Wednesday it touched it with high volume, but on Friday it was rejected with low volume.
From a daily, weekly and monthly perspective, the most promising FAANG stocks are:
AAPL remains the most promising stock in this group.
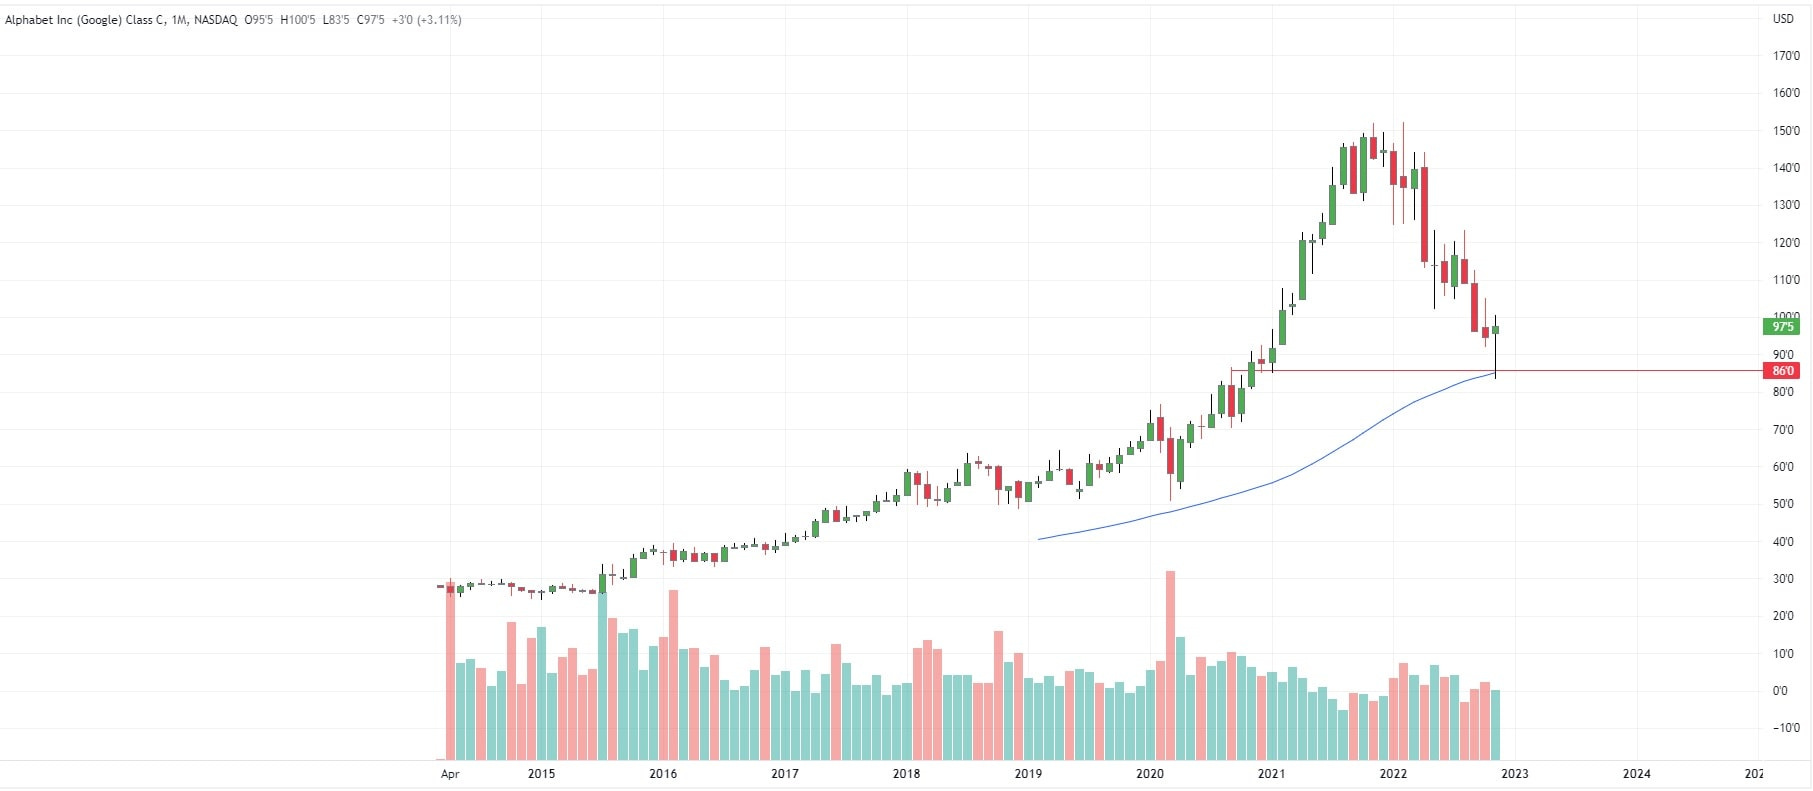
GOOG is printing a bullish monthly candle, if the pattern continues GOOG will be a very nice long trade. It managed to close back above the 200WMA and the 60MMA (5yr).
AMZN remains weak, but maybe the Black Friday and Cyber Monday sales will give it a boost.
SMH
Aside from the FAANG stock index, the semiconductor sector is doing quite well and helping the market a lot. TXN and LSCC are two of the best looking stocks in this sector, but AVGO, NVDA, AMD and even INTC are also looking good. We expect SMH to reach 239, its Inverted Head-and-Shoulders target.

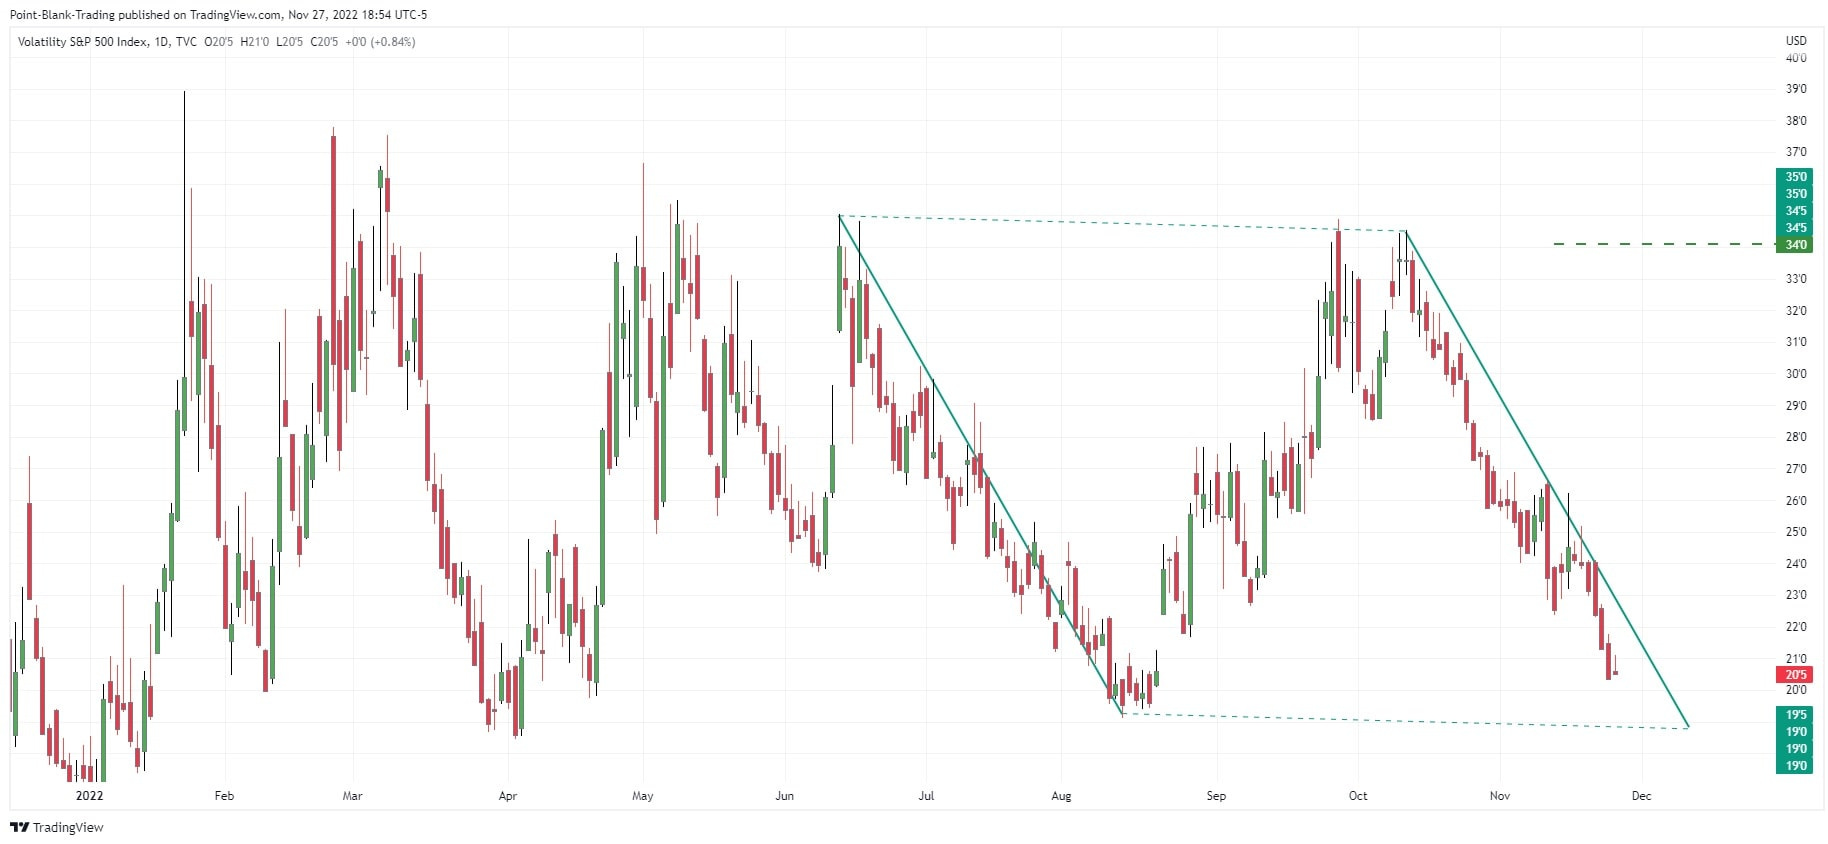
VIX / VVIX
If the patterns repeat, it looks like VIX will need to get to 19 before having a respectful bounce. Our long-term Regression Channel indicates something similar: VIX has to get to 19.5 to have a decent bounce. At the moment it is still stuck in a strong downtrend.
VVIX is also trapped in a strong downtrend. The long-term Regression Channel shows that it has broken several times since October 28 below the Comfort Zone, the reddish area between +2/-2 stdev. This is a rare occurrence that has not happened since May 2014, when it broke out only one day. This indicates that VVIX is extremely oversold. A snapback rally could occur at any time.
DXY
It is in a correction right now. The dollar index has had a strong correlation with the SPX lately. Of course, it is of interest to stock market traders.
Based on the long-term Regression Channels, we called for the current correction when it was at 112.5. According to that channel, the next target is 105, and eventually 102.5, the mean of the channel, i.e., the Linear Regression Line.
It printed a very bearish monthly impulsive candle.
We will follow the DXY very closely and post any observations on our Twitter account.

CLASSIC INDICATORS AND SPX
CCI: It is in overbought territory, pointing to the downside and presents a strong negative divergence with the market. Watch.
RSI: It is in an uptrend and shows no divergences or immediate downward signals.
STOCHASTICS: It is in overbought territory, with no divergences or sell signals.
MACD: It is in uptrend and above zero. It is not oversold and its buy signal is still valid.
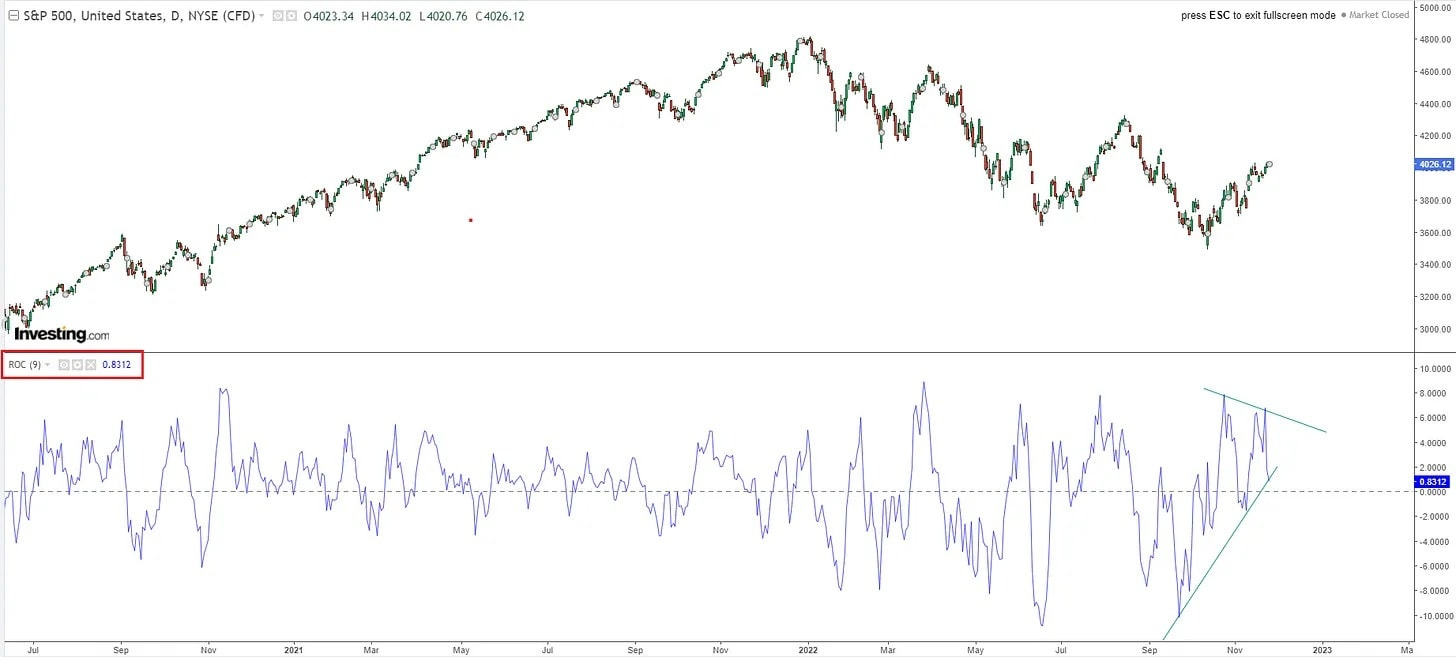
ROC: It points downwards and presents a negative divergence with the market. It is still above zero.
WILLIAM'S % R: It is in overbought territory, shows no divergence or sell signals.
In conclusion, the classic indicators remain positive and are mostly in overbought territory, but we all know that overbought does not mean sell because the market can remain overbought for longer.
What we should pay attention to is the divergences shown by the CCI and the ROC, we cannot forget that these two indicators showed positive divergences already in September signaling a possible temporary bottom, which was the case.

WHY OUR INMEDIATE TARGET IS 4074?
For those of you who don't remember, at the end of May we published on our Twitter account, and also in our newsletter a post about what we called the Noise Box. We mentioned that rupture in any direction outside of that box would generate a large movement.
The box broke through the bottom edge and the SPX fell over 11% in just 6 days. The end of that drop was the June lows.
That Noise Box is just a congestion zone where the SPX was trapped for 9 straight days bouncing from top to bottom. The big drop after the break of the bottom of the box brought it great relevance.
There was a rally after the June lows and the SPX re-entered the box where it stayed exactly another 9 days before breaking above the top of it. It only lasted 8 days out until re-entering the box. You can see the rest of the story for yourself.
We expect the SPX to at least approach the 4074 level, then we will see. If it does manage to break into the box, the logical target would be 4181, the top of the box, with a possible stop at the 4125 level which is about half of the box.

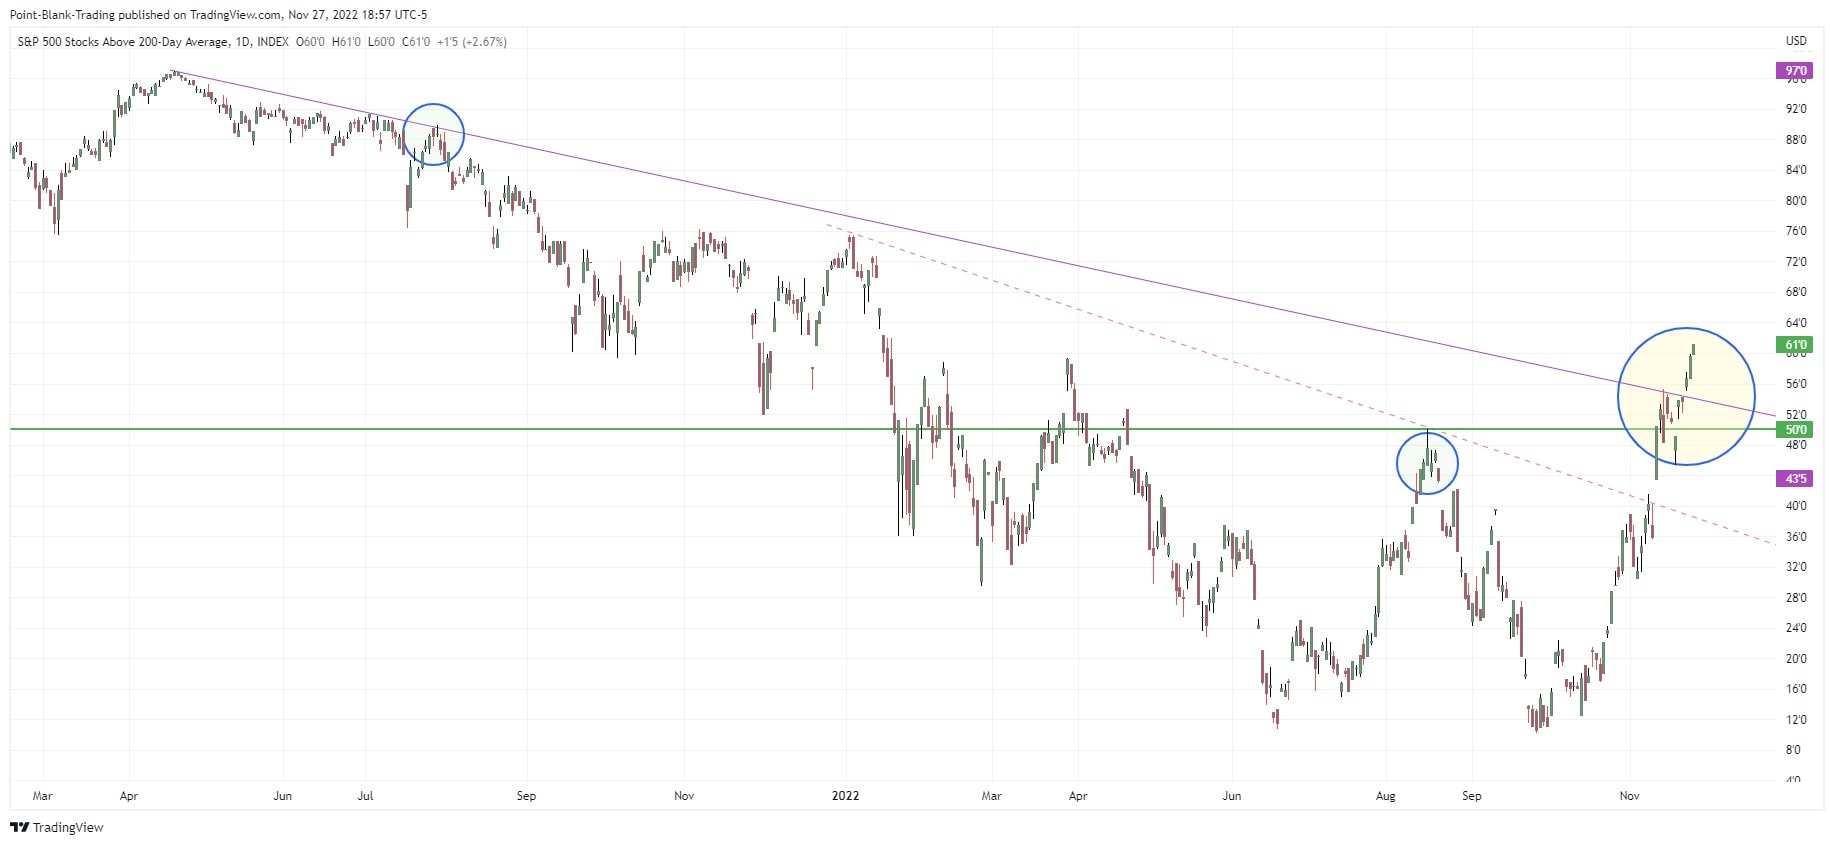
MARKET BREADTH
What are we seeing different this time that has kept us bullish?
Our favorite indicator of the internal health of the market is the SPX stocks above the 200DMA Index (S5TH in Tradingview). For an SPX uptrend to be valid this indicator has to be above 50% and above its own 200DMA.
Bullishness:
•The indicator broke above a short-term trend line that had been in place since January'2022.
•It also broke above the dominant trend line that has been in place since April'2021.
•It has been above its 200DMA for 13 days after successfully retesting the breakout.
•It is above the August and March highs. I
•It is ahead of the SPX and this is usually bullish. This is a very positive divergence.
If headlines, events or announcements cause the SPX to drop sharply, of course this indicator will drop as well, but you have to understand that right now it is showing a lot of internal market strength that is not visible just by looking at the SPX chart.
To learn more about this indicator and its correlation with the SPX, see our past newsletter, https://bit.ly/3ELalcn , and this post, https://bit.ly/3ELalcn , we did on Tradingview on March 20 (English translation is in the comments)
As for the SPX stock index above the 50DMA (S5FI in Tradingview), it closed at 89.5 very close to the extremely overbought zone, above 91.5.
Getting to or above that level does not mean the end of the rally, as it may spend some time in the zone, but it will eventually signal a major pullback. The best signal comes when it goes back below 89/90. Keep an eye on this.
POWELL, WILL DERAIL THE RALLY?
Next week there will be some market shaking events such as the JOLTS job opening report, the non-farm payrolls, employment report, core PCE, ISM manufacturing report, GDP numbers and so on, but one that will be closely monitor is the Powell’s speech on Wednesday, and there are other 8 FOMC members due to speak this week as well.
Most likely they will all maintain the hawkish tone that the other FOMC members who spoke last week have maintained. They have said that rates will go to 5%, they have even mentioned the possibility of 7%, that they don't stop raising rates until inflation comes down to their desired levels even if that means pain, unemployment, bankruptcies or your cat starving to death, etc etc etc.
We believe there is in the market an underlying sentiment shift that managed to weather the major bad news over the past few weeks, starting with the CPI announcement in October that pushed the market down so hard that the rubber effect kicked in causing a sharp reversal and subsequent rally days.
Despite the obvious unfavorable macro information, we believe that the market, after any Powell shock, will settle down and continue a slow pace upward, until next year, when a reality call may take us to lower grounds.
However, at the moment there is a congestion of circumstances we need to pay attention to. We believe that the trend line and the 200DMA of the SPX and Powell speech will be coincidentally very closely correlated.
There are a lot of people who are waiting for the SPX to approach those levels, which will most likely coincide with Powell's speech, to make the short of their lives. At that point, the market may have a logical and perhaps even dramatic pullback from those levels, which may bring some life back into the VIX, but it will eventually compose itself and continue its upward movement, and the VIX would resume its downtrend.
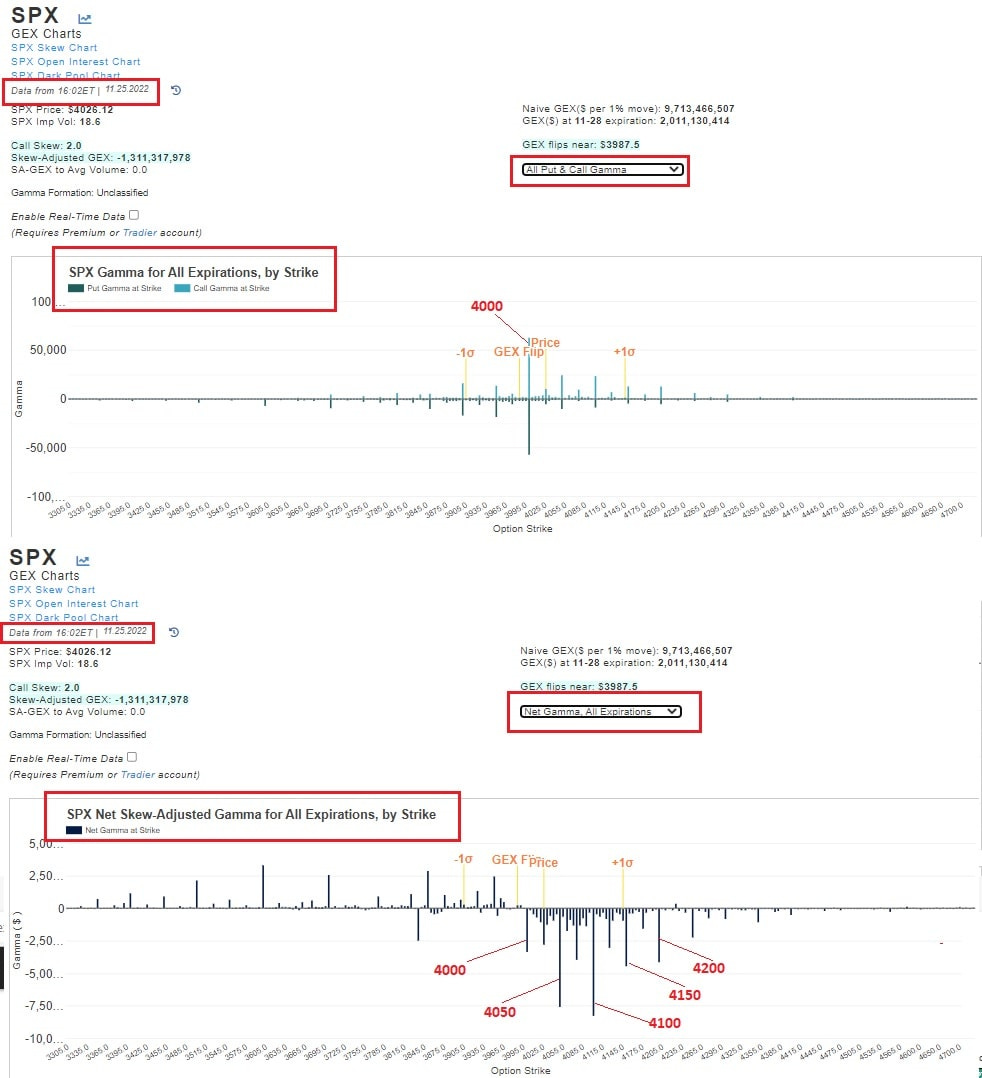
GAMMA Exposure.
Data and Charts from @TradeVolatility
The SPX Gamma for All Expirations, all puts and calls chart shows that after a couple of months the 4000 is back in the center of attraction.
The SPX price is in positive Gamma territory and as a result is in a low volatility environment. Market makers will hedge their positions by acting contrary to the direction of the markets. This is why we are seeing range compression for the day.
The SPX Net S/A Gamma for All Expiration shows most Gamma is negative and concentrated between 4000 and 4250, with the main stack at 4100.
Tomorrow we will post on our Twitter account the GEX chart the GEX chart for the End of Month option expiration, also known as EOD Opex. It will be interesting what the positioning of traders is with all the announcements we will have this week.
OUTLOOK
There are some very clear bullish factors such as breadth indicators, weekly or monthly bullish candles, successful bounces from important support levels, seasonality and more that can persuade anyone that further upward movements are on the horizon, but there are also some bearish aspects to take into account, mainly:
•VIX and the VVIX are very oversold and near support. A snapback rally could occur at any time.
•There are negative divergences between the SPX and the CCI and ROC, indicators that have produced divergence-based leading signals in the past.
•The fact that the entire crowd is waiting for the market to approach the 200DMA and trend line to get short. This may coincide with Powell's speech or the results of the numerous announcements this week, such as core PCE, nonfarm payrolls, JOLTS job openings, ISM, GDP, etc. The initial selling will push the market lower, but won’t kill the rally. We think this pullback will be a good opportunity to reposition longs.
Trading around those days requires a great deal of caution. If you are trading long or short, do so with good risk management.
The risk/reward moving forward doesn't look so attractive, especially with all the announcements this week, and our SPX target so close. However, here's what we expect for this week:
•The market to open and close higher on Monday
•SPX to hit our target of 4074
•FAANG index to break above the 50DMA
•QQQ to break above 100DMA
•RUT to break above 200DMA
Overall, we expect the current uptrend in the market to continue for the rest of the year, with the usual pullbacks and struggling to overcome resistance.
Our next target, once 4074 is reached, will be 4185, and if there are no major setbacks 4300 will be the final target.
What can make us change our minds?
•IWM and QQQ closing below 20DMA
•SPX closing below 3900
•DJI closing below 33160
Trade smart, manage risk, and make money.
Have a nice trading week.